“life-expectancy” Charts
Dying to Know: What Are the Top Causes of Death in America »
In the U.S., average life expectancy rates are the highest they've ever been, at roughly 79 years. We're living longer,…
#HeforShe: Afghanistan's Low Life Expectancy for Women »
This impoverished nation exhibits extremely low life expectancy for women. After three decades of war, a broken healthcare system, religious…
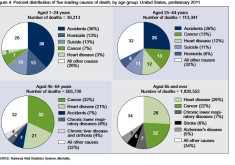
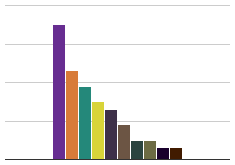
Top Five Causes of Death By Age Group: 2011 »
In 2011, for individuals aged 1-24 and 25-44 years old, accidents were the leading cause of death. This percent gradually…
Men Across the World Committing Suicide in Much Higher Rates »
Around the globe, males commit suicide in rates three and four that of females. In Asia and Pacific-island countries the…
Suicide Rate Increase Surges 500% with the Recession »
Almost all of the increase in suicides since 1999 has been driven by the aging baby boomer generation, whose sensitivity…
A Situation Where Whites Are Disproportionately Dying »
Historically, suicide rates have steadily declined, though in recent years, this trend has reversed. White males constitute the vast majority…
Suicide Rates Vary Significantly by State, Region »
Suicide rates among the states expresses an unsettling correlation between where you live and the likelihood of suicide. Mountain states…
A National Mid-Life Crisis: Middle-Age Suicides Skyrocket »
Suicides, usually considered a problem of teenagers and the elderly, have sharply risen among middled-aged Americans in recent years, nearly…
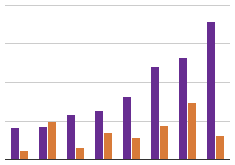
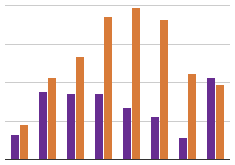
Life Expectancy by Age »
This chart displays the life expectancy by current age of male and female Americans in 2010. If you are lucky…
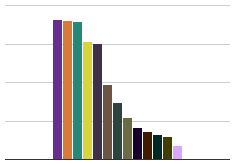
Top Ten Countries: Life Expectancy »
These countries represent the ten countries with the highest life expectancies.
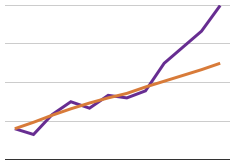
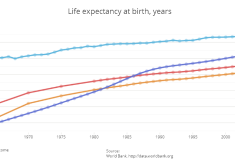
Life Expectancy »
Life expectancy is on an upward trend. This includes both developed and developing countries.
Organisms with Short Lives »
Remember there are roughly 52 weeks in a year. Further, a common denominator among these animals is their size. They…
Politicans Have A Shorter Lifespan, Though Not By Much »
Members of Congress have an ever so slightly shorter lifespan than your average American - but it certainly doesn't feel…
82 is the Magic Number »
When it comes to life expectancy, the magic number seems to be 82. Switzerland, Japan, Italy, Spain and Iceland all…
Working Life Expectancy in Europe »
While unemployment rate as well as other standard indicators of economic activity focus on specific stages of person's life cycle,…
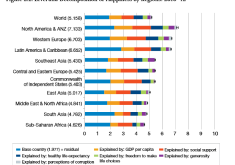
Breakdown of Regional Happiness »
In each region, happiness is mostly explained by GDP per capita, social support and healthy life expectancy. Other factors like…
U.S. Life Expectancy Consistently Below OECD Average »
The average life expectancy in the U.S. has consistently fallen under the average life expectancy of the Organisation for Economic…
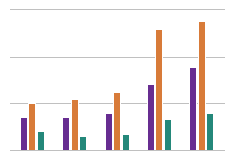
Women More Likely To Die From Alzheimer's Disease »
In 2010, women experienced a higher incidence of deaths relating to Alzheimer's disease. Women were a 30 percent more likely…
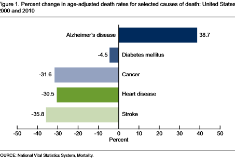
Percent Change In Death Rates By Causes Of Death »
From 2000 to 2010, the death rate for Alzheimer's disease increased. However, the death rates for diabetes mellitus, cancer, heart…
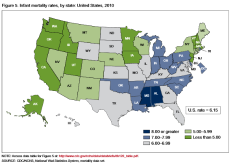
Infant Mortality Rates By State: 2010 »
In 2010, infant mortality rates were highest in the South and Midwest regions. 13 states and the District of Columbia…
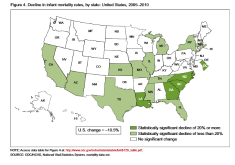
Infant Mortality Rate Trends By State: 2005-2010 »
From 2005 to 2010, Georgia, Louisiana, North Carolina, South Carolina and the District of Columbia experienced a decline of 20%…
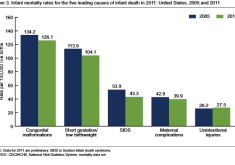
Top Five Causes of Infant Death: 2005-2011 »
In 2011, these top five causes accounted for 56% of all infant deaths in the United States. The leading cause…
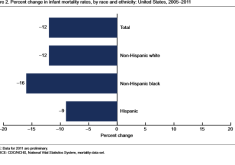
Infant Mortality Rate Trends By Race »
Infant mortality rates for non-Hispanic black women are usually two times greater than the rates for non-Hispanic white women. From…
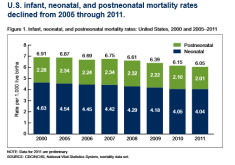
Neonatal And Postneonatal Mortality Rates Decline: 2005-11 »
From 2005 to 2011, neonatal and postneonatal mortality rates declined in the United States. This means that death during the…
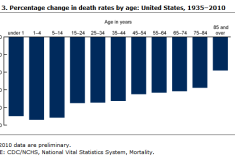
Percent Change In Death Rates By Age: 1935-2010 »
From 1935 to 2010, the most significant decreases in death rates occurred among the younger age groups. The greatest decrease…
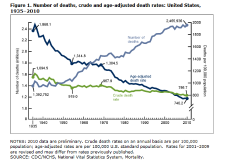
The Death Rate Is Decreasing »
Even though the number of deaths has increased from 1935 to 2010, the age-adjusted death rate decreased during this time.
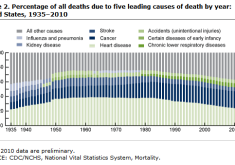
Top Causes of Death »
Since 1935, heart disease and cancer have remained the first and second leading causes of death, respectively in America. Stroke…
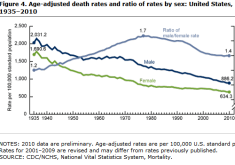
US Death Rate Trends By Sex »
Since 1935, US males tend to have higher death rates than females. This gap peaked during the years 1975-1981, when…
2011: Death Rates By State »
In 2011, death rates were higher in the South Eastern and Mid-Atlantic regions of the United States. Midwest and South…
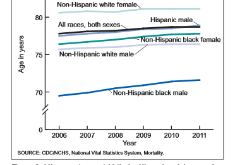
US Life Expectancy Trends by Race, Ethnicity and Gender »
The non-Hispanic black male population experienced the most significant increase in life expectancy during the years 2006-2010. All populations experienced…
Where You Live = If You Live; World's Most Polluted Cities »
In many of the most densely populated cities, air quality is so low that citizens actually suffer health disorders, and…
Drunk Driving Fatal Crashes, by Age Group »
In 2008, 11,773 fatalities (23% of all traffic fatalities) were the result of alcohol-impaired driving, a 6% decrease since 1998.…
Probability of Dying by Age »
This chart displays the probability of dying by age for Americans in 2010. The probability of dying is slightly higher…


