| Probability of dying | |
|---|---|
| 0-1 | 0.6 |
| 1-5 | 0.11 |
| 5-10 | 0.06 |
| 10-15 | 0.07 |
| 15-20 | 0.25 |
| 20-25 | 0.43 |
| 25-30 | 0.48 |
| 30-35 | 0.55 |
| 35-40 | 0.69 |
| 40-45 | 1 |
| 45-50 | 1.6 |
| 50-55 | 2.43 |
| 55-60 | 3.51 |
| 60-65 | 4.98 |
| 65-70 | 7.44 |
| 70-75 | 11.23 |
| 75-80 | 17.48 |
| 80-85 | 27.44 |
| 85-90 | 43.09 |
| 90-95 | 61.52 |
| 95-100 | 78.31 |
| 100 and over | 100 |
Age
Probability of dying
Sources:
cdc.gov

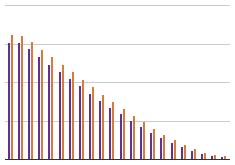
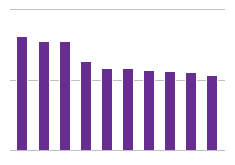
This chart displays the probability of dying by age for Americans in 2010. The probability of dying is slightly higher for infants than for teens and young adults, but besides this, the older you get, the higher the probability of dying.