Drunk Driving Fatal Crashes, by Age Group
by Anthony Sibley (AJ) on Jul 13, 2013 | Views: 386 | Score: 0
| Younger than 16 | 16-20 | 21-24 | 25-34 | 35-44 | 45-54 | 55-64 | 65-74 | 75 and Older | |
|---|---|---|---|---|---|---|---|---|---|
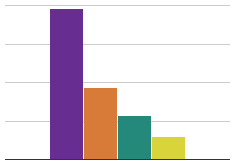
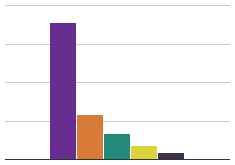
| Percentage of Drivers in Age Group Involved in Alcohol-Related Fatal Crash | 10 | 17.5 | 34 | 31 | 25 | 11.5 | 8 | 7.5 | 4 |
Percentage of Drivers In Given Age Group Involved in Alcohol-Related Fatal Crashes (estimate*)
Sources:
www-nrd.nhtsa.dot.gov

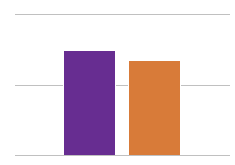
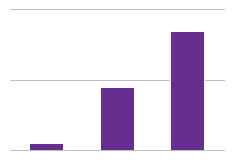
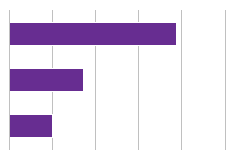
In 2008, 11,773 fatalities (23% of all traffic fatalities) were the result of alcohol-impaired driving, a 6% decrease since 1998. This is an average of one alcohol-related death every 45 minutes. Over 1.43 million Americans were arrested for driving under-the-influence in 2007, or 1 in every 144 drivers. The percentages of age groups involved in fatal alcohol crashes are reported.