| Male | Female | |
|---|---|---|
| 0 | 76.2 | 81 |
| 1 | 75.7 | 80.5 |
| 5 | 71.8 | 76.6 |
| 10 | 66.8 | 71.6 |
| 15 | 61.9 | 66.6 |
| 20 | 57.1 | 61.7 |
| 25 | 52.4 | 56.9 |
| 30 | 47.8 | 52 |
| 35 | 43.1 | 47.2 |
| 40 | 38.5 | 42.4 |
| 45 | 33.9 | 37.7 |
| 50 | 29.6 | 33.2 |
| 55 | 25.4 | 28.8 |
| 60 | 21.5 | 24.5 |
| 65 | 17.7 | 20.3 |
| 70 | 14.2 | 16.5 |
| 75 | 11 | 12.9 |
| 80 | 8.2 | 9.7 |
| 85 | 5.8 | 6.9 |
| 90 | 4.1 | 4.8 |
| 95 | 2.9 | 3.3 |
| 100 | 2.1 | 2.3 |
Exact Age
Life Expectancy by Age
Sources:
cdc.gov

 of
of
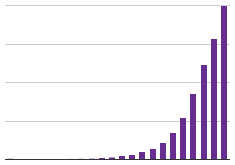
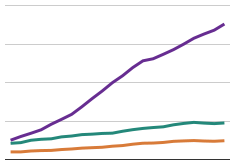
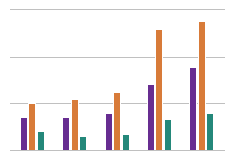
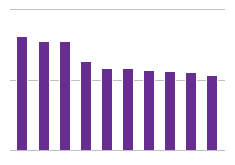
This chart displays the life expectancy by current age of male and female Americans in 2010. If you are lucky enough to live to be 90, you on average have about 4 and a half years left to live.