“electricity” Charts
Renewable Energy Passes Nuclear, But 7x Behind Fossil Fuels »
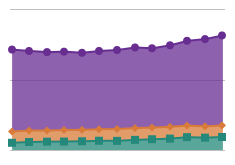
Despite gains in production by renewable energy, almost doubling in its ability to produce between 2001 and 2013, and surpassing…
Affordable Solar in Your Future »
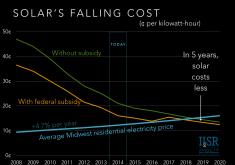
This chart gives the big picture on solar costs with the most conservative example: solar energy in the Midwest –…
Decrease in Number of Oil Spills »
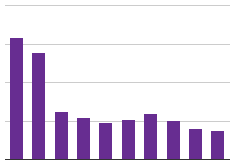
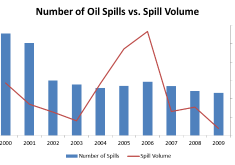
The number of oil spills in U.S. water has decreased by more than 50%, from 8,354 spills in 2000 to…
Solar Means Huge Economic Benefits for Missouri »
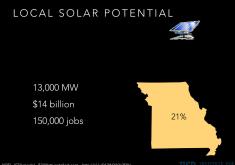
According to the Institute for Local Self-Reliance, 21% of Missouri's power could come from rooftop solar energy. And that could…
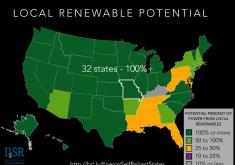
States Have Enormous Local Renewable Energy Potential »
States don't need dirty energy and most don't need to import energy, either. This map illustrates the state-by-state potential to…
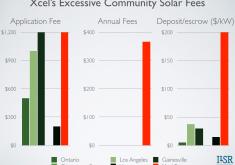
Improvements Needed to Xcel’s Proposed MN Solar Program »
Xcel Energy has published their proposed community solar program on September 30, 2013. The Institute for Local Self-Reliance has submitted…
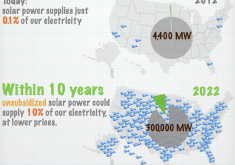
Are We Ready for a Solar Rooftop Revolution? »
Solar power is getting cheaper and growing faster every year. Are our utilities ready for a swarm of customer-owned solar…
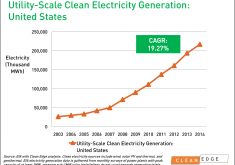
Utility Scale Clean Electricity Generation »
Over 200,000 Megawatt hours of generated electricity came from renewable power sources in 2014. This is the first time in…
How much do American Homeowners Pay to Keep the Lights On? »
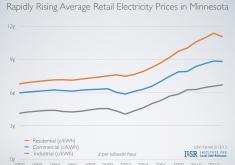
The price per kilowatt-hour of electricity has been increasing steadily since 2002, but the price climbed most steeply between 2002…
Where Does Our Electricity Come From? »
When you flick on a light or check your email, you are using electricity. What but natural resources are used…
U.S. Power Just a Drop in the Global CO2 Emissions Bucket »
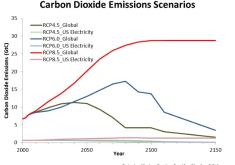
This chart shows three carbon dioxide emissions pathways generated from IPCC scenarios (one high-end, one low-end, and one middle of…
Who's Keeping Your Lights On? Sources of Alternative Energy »
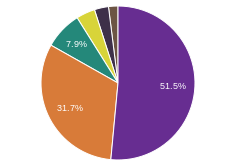
The majority of U.S. electricity is created by coal, but 13% is created by renewable resources. Of these resources, hydroelectric…
Energy in Minnesota: Nothing Xcels Except the Price »
Xcel’s retail electricity rates have risen nearly 40% in the past decade and the utility announced its intention to increase…
Which States Allow "Shared Renewables"? »
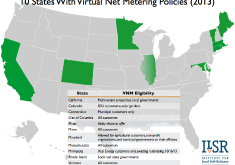
10 states and the District of Columbia allow virtual net metering or "shared renewables," a policy that allows many people…
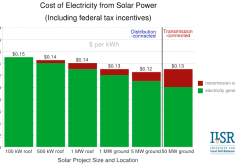
Cost of Electricity from Solar Power »
Coal may seem cheap, but transmission costs and power losses from centralized power stations can offset any economies of scale.…
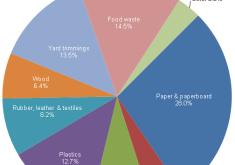
Waste Generation by Material »
In 2011, Americans generated 250 million tons of municipal solid waste. Paper and paperboard accounted for 28% of this waste,…
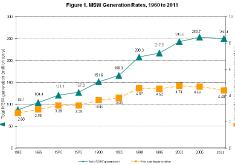
Americans Are Generating Less Waste »
In 2011, Americans generated 250.4 million tons of municipal solid waste, 3.3 million tons less than in 2005. This decrease…
Recycling Rates Keep Climbing »
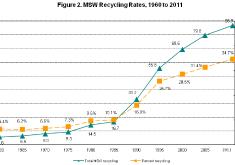
Of the 250.4 million tons of municipal solid waste (trash) generated by Americans in 2011, 86.9 million tons (34.7%) of…
Are Oil Spills a Fading Problem? »
Oil spills in U.S. water have decreased from 8,354 spills in 2000 to 3,492 in 2009. However, spill volume has…
U.S. Electricity Generation by Fuel Type »
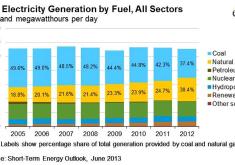
The U.S. is relying more on natural gas and less on coal to generate electricity. In 2005, 49.6% of electricity…

