
The Colored Lens of Criminal Injustice: Wrongful Conviction
by Anthony Sibley (AJ) on Jul 14, 2013 | Views: 371 | Score: 0
| Wrongful Conviction Rate | |
|---|---|
| New Orleans, LA | 13.374 |
| Suffolk, MA (Boston) | 9.308 |
| Kern, CA | 8.426 |
| Jefferson, LA | 6.542 |
| Dallas, TX | 5.377 |
| Cook, IL (Chicago) | 5.311 |
| Clark, WA | 4.158 |
| DC | 4.115 |
| Wayne, MI (Detroit) | 3.497 |
| Bronx, NY | 2.831 |
| Nation | 1 |
Top 10 Counties with Populations over 300,000
Exonerations per Capita, Standardized
Sources:
law.umich.edu, en.wikipedia.org
Share:

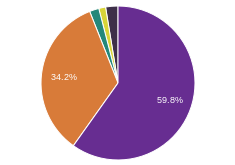
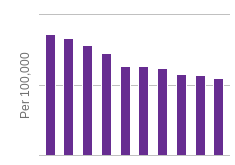
Among the 10 counties with the highest wrongful convictions (exonerations) per capita, eight have rates that exceed the national average by over 400%. Of theses counties, all but one have minority-majority populations with sizable African-American and Hispanic communities. Conversely, of large counties in which no one has been found to have been wrongfully convicted of a crime, all have White/Asian combined majorities of over 70%, and relatively tiny Hispanic and black populations. Most exonerations have been for sexual assault, with the wrongfully convicted being disproportionately black.