“consumers” Charts
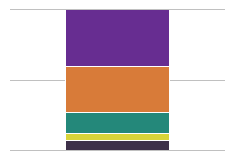
Where U.S. Victims of Fraud Were First Contacted (2013) »
The Federal Trade Commission received over one million complaints of fraud in the 2013 calendar year. According to the FTC…
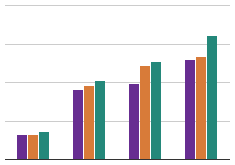
Changes in Consumer Expenditures »
Since overall expenditures began to increase again in 2011, cash contributions, health care, and transportation have had the largest percentage…
Cha-Ching! American Spending Strong »
American spending is stronger today than in the past, and the strongest since the recession. This reflects higher confidence in…
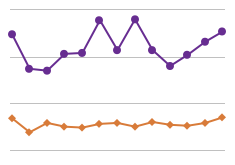
December Spending Strong Among High and Low Income Americans »
As we can guess, December spending peaks for Americans during the holiday season, and this was the case just last…
Americans Are Spending More on Health Care »
Average total expenditures in 2012 were $51,442, an increase of 3.5 percent from 2011 levels. Most of the major components…
Expenditures On Housing Are Rising Modestly »
Average expenditures per consumer in 2012 increased by 3.5 percent from 2011. Most of the major components of household spending…
Americans More Likely to Eat At Home »
In 2012, the average annual expenditure for food at home was significantly higher than the expenditure for food away from…
Where Do Consumers Like to Spend Their Money? »
This chart shows the average annual consumer expenditures for the year 2012. Health insurance routinely consumes nearly 60 percent of…
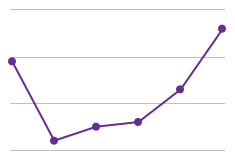
Percent Change In Real Personal Consumption Expenditures »
With the exception of two quarters, the percent change from the preceding period in real personal consumption expenditures was higher…

