Rising Concentration of US Income in the Upper Classes
by Shane M. on May 12, 2014 | Views: 223 | Score: 0
| United States Pre-Tax Gini Coefficient | |
|---|---|
| 1952 | 0.368 |
| 1957 | 0.351 |
| 1962 | 0.362 |
| 1967 | 0.358 |
| 1972 | 0.359 |
| 1977 | 0.363 |
| 1982 | 0.38 |
| 1987 | 0.393 |
| 1992 | 0.404 |
| 1997 | 0.429 |
| 2002 | 0.434 |
| 2007 | 0.432 |
| 2012 | 0.451 |
Year
Sources:
census.gov

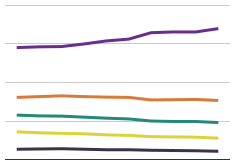
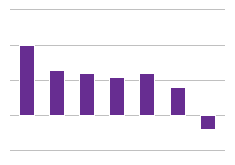
This chart shows the US Gini Coefficient (or ratio), the measure of income inequality most widely used by economists, over time. Increases in ratio signify increases in income inequality (i.e. more money concentrated at top income levels). Clearly, income inequality is steadily rising, and shows no signs of slowing down.