
| Top Fifth of Income Earners | Second Fifth of Income Earners | Third Fifth of Income Earners | Fourth Fifth of Income Earners | Botttom Fifth of Income Earners | |
|---|---|---|---|---|---|
| 1967 | 43.6 | 24.2 | 17.3 | 10.8 | 4 |
| 1972 | 43.9 | 24.5 | 17 | 10.4 | 4.1 |
| 1977 | 44 | 24.8 | 16.9 | 10.2 | 4.2 |
| 1982 | 45 | 24.5 | 16.5 | 10 | 4 |
| 1987 | 46.2 | 24.3 | 16.1 | 9.6 | 3.8 |
| 1992 | 46.9 | 24.2 | 15.8 | 9.4 | 3.8 |
| 1997 | 49.4 | 23.2 | 15 | 8.9 | 3.6 |
| 2002 | 49.7 | 23.3 | 14.8 | 8.8 | 3.5 |
| 2007 | 49.7 | 23.4 | 14.8 | 8.7 | 3.4 |
| 2012 | 51 | 23 | 14.4 | 8.3 | 3.2 |
Year
Percentage of Total US Income Held By Each Group
Sources:
census.gov
Share:

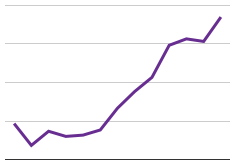
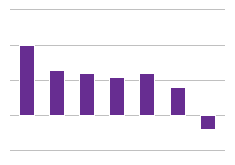
This chart measures each income group's share of total US income over time. From 1967 to 2012, the top fifth of income earners have steadily increased their share of total income, at the expense of every other group, whose shares have dropped.