
“index” Charts
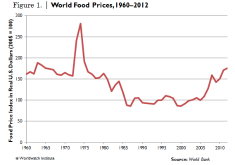
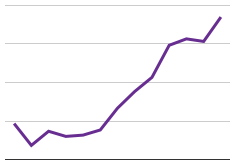
World Food Prices On the Rise »
Continuing a decade-long increase, global food prices rose 2.7 percent in 2012, reaching levels not seen since the 1960s and…

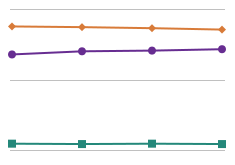
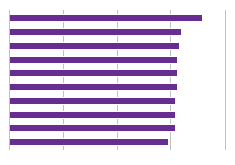
U.S Weight Monthly in 2015 »
This chart shows how the percentage of Americans BMI scores have been since the start of 2015.
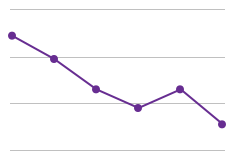
Unemployment Rate Down from 2014 »
Gallup's U.S. unemployment rate represents the percentage of adults in the workforce who did not have any paid work in…

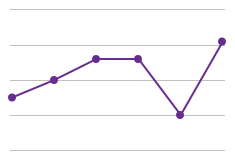
American Workforce Ringing In a Strong 2015 »
The U.S. Payroll to Population rate (P2P) is the percentage of the U.S. adult population aged 18 and older who…
The Worst Countries To Be A Christian »
The index of the persecution of Christians is a measure that attempts to quantify the amount of religious persecution against…
Rising Concentration of US Income in the Upper Classes »
This chart shows the US Gini Coefficient (or ratio), the measure of income inequality most widely used by economists, over…

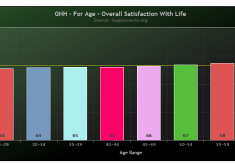
Gross National Happiness: Overall Satisfaction By Age »
This chart represents the scores of the 18,600 people who took the Gross National Happiness Index survey. The GNH Index…
