| Mobile | Desktop / Laptop | Other Connected Devices | |
|---|---|---|---|
| 2008 | 0.3 | 2.2 | 0.2 |
| 2009 | 0.3 | 2.3 | 0.3 |
| 2010 | 0.4 | 2.4 | 0.4 |
| 2011 | 0.8 | 2.6 | 0.3 |
| 2012 | 1.6 | 2.5 | 0.3 |
| 2013 | 2.3 | 2.3 | 0.3 |
| 2014 | 2.6 | 2.4 | 0.3 |
| 2015 | 2.8 | 2.4 | 0.4 |
Time spent per adult user per day with digital media
Hours Per Day
Sources:
kpcb.com

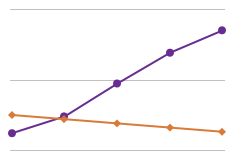
Mobile media consumption is a growing trend throughout the United States. While in 2008, Americans only spent less than a half an hour viewing digital media on their mobile device, by 2015, the amount of time has increased nearly tenfold. Americans today spend as much time on their mobile device as all other sources of digital media combined.