
Government Professionals: Salary and Race
by Alejandro Esquino Gomez on Apr 12, 2015 | Views: 436 | Score: 1
| White | Black | Hispanic | Asian | Indian | |
|---|---|---|---|---|---|
| 0.1-15.9 | 83.6 | 9.7 | 4.1 | 2.1 | 0.5 |
| 16.0-19.9 | 66.4 | 19 | 12.6 | 1.4 | 0.6 |
| 20.0-24.9 | 61 | 30.5 | 6.7 | 1.2 | 0.6 |
| 25.0-32.9 | 60.9 | 28.6 | 8 | 1.6 | 1 |
| 33.0-42.9 | 67.5 | 21.8 | 7.6 | 2.3 | 0.7 |
| 43.0-54.9 | 71 | 16.9 | 7.5 | 4 | 0.6 |
| 55.0-69.9 | 70.7 | 14.8 | 7.2 | 6.6 | 0.6 |
| 70.0+ | 70.8 | 11.1 | 7 | 10.5 | 0.5 |
Race
Annual Salary $K
%
Sources:
eeoc.gov
Share:

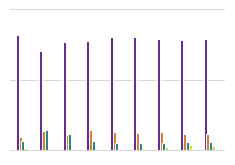
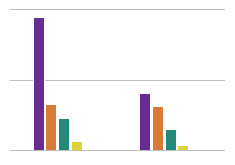

(Data from 2009) It is clear that whites are still the predominant group in professional government employment at all salary levels. However, the data concerning government professionals has a dip in the proportion of whites working the jobs in the 2nd, 3rd and 4th salary ranges; while the data for government officials and administrators does not. Also, among the highest salary range there is an interesting spike in the percentage of Asian employees.