Government Officials/ Administrators Workers By Race
by Alejandro Esquino Gomez on Apr 12, 2015 | Views: 243 | Score: 0
| White | Black | Hispanic | Asian | Indian | |
|---|---|---|---|---|---|
| 0.1 - 15.9 | 82.2 | 9.3 | 6.6 | 1.4 | 0.4 |
| 16.0 - 19.9 | 70.8 | 13.6 | 14.6 | 0.6 | 0.5 |
| 20.0 - 24.9 | 77 | 10.7 | 11.3 | 0.4 | 0.6 |
| 25.0 - 32.9 | 78.1 | 14.2 | 6.7 | 0.5 | 0.5 |
| 33.0 - 42.9 | 80.5 | 12.8 | 5.3 | 0.9 | 0.5 |
| 43.0 - 54.9 | 80.5 | 12.2 | 5.3 | 1.4 | 0.5 |
| 55.0 - 69.9 | 79.5 | 12.6 | 5.2 | 2.1 | 0.6 |
| 70.0 + | 78.9 | 11.1 | 5.7 | 3.8 | 0.5 |
| 79.3 | 11.7 | 5.7 | 2.8 | 0.5 |
Race
Annual Salary $ K
%
Sources:
eeoc.gov

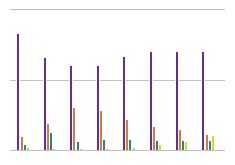
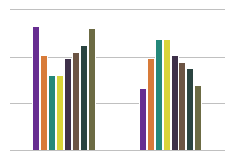
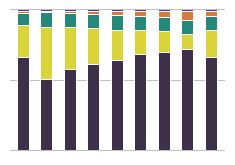
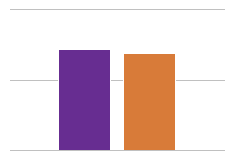
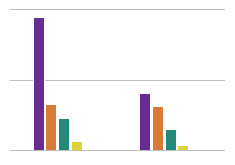
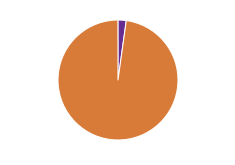
(Data from 2009) White people represent a large majority of the officials/ administrators in the government. While there is a clear disparity in employment by race, the real question is whether this is reflective of the national employment demographics and the national racial composition of the United States.