
National Aggregate Full-Time Employment BreakDown By Race
by Alejandro Esquino Gomez on Apr 11, 2015 | Views: 223 | Score: 0
| Indian | Asian | Hispanic | Black | White | |
|---|---|---|---|---|---|
| 0.1 - 15.9 | 0.9 | 1.5 | 8.1 | 23.1 | 66.4 |
| 16.0 - 19.9 | 0.7 | 0.9 | 10.5 | 36.9 | 51 |
| 20.0 - 24.9 | 0.7 | 1.1 | 10.6 | 29.9 | 57.7 |
| 25.0 - 32.9 | 0.8 | 1.9 | 10.5 | 25.5 | 61.3 |
| 33.0 - 42.9 | 0.7 | 2.7 | 10.6 | 21.5 | 64.5 |
| 43.0 - 54.9 | 0.7 | 3.3 | 10 | 17.7 | 68.2 |
| 55.0 - 69.9 | 0.6 | 4.7 | 9.5 | 15.2 | 70 |
| 70.0 + | 0.6 | 6.8 | 9.4 | 11.2 | 72 |
| Total | 0.7 | 3.6 | 10 | 19.2 | 66.5 |
Race
%
Sources:
eeoc.gov
Share:

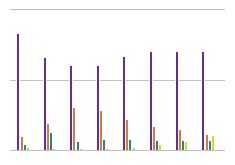
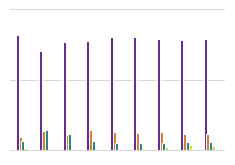
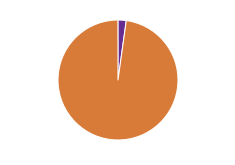
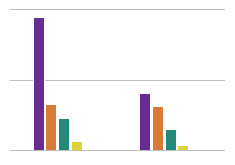
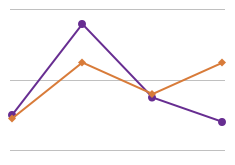
(Data from 2009) As has been the trend in this series in all wage categories whites are the predominant group. Perhaps, data on other sections of government employment in this chart series may be representative of the national average. Another question is whether they are representative of the American population.