
Government Officials Administrators Workers By Sex
by Alejandro Esquino Gomez on Apr 12, 2015 | Views: 255 | Score: 0
| 0.1 - 15.9 | 16.0 - 19.9 | 20.0 - 24.9 | 25.0 - 32.9 | 33.0 - 42.9 | 43.0 - 54.9 | 55.0 - 69.9 | 70.0 + | |
|---|---|---|---|---|---|---|---|---|
| Male | 66.5 | 50.8 | 40.4 | 40.4 | 49.2 | 52.7 | 56.4 | 65.4 |
| Female | 33.4 | 49.2 | 59.6 | 59.6 | 50.8 | 47.3 | 43.7 | 34.6 |
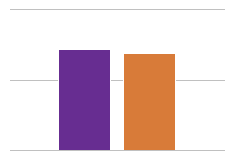
Annual Salary $K
Officials Administrators
%
Sources:
eeoc.gov
Share:

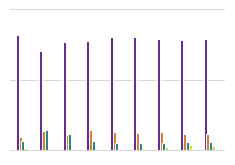
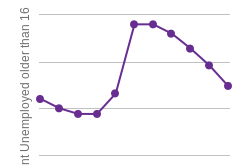
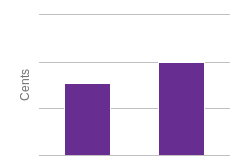
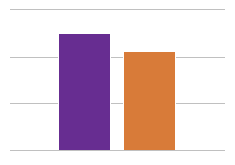
(Data from 2009) Notably, a large percentage of men do the lowest and the highest paying jobs while women are more present in jobs closer to the median income range.
That's a very interesting range. Most likely manual labor and management I would guess, as gendered as they are in the United States.
I think that is a sound line of reasoning.