“material” Charts
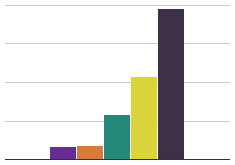
Amount Spent on Material Purchases »
TV, Stereo and Computer purchases were the most expensive purchases within the material condition with a median amount of $235.00…
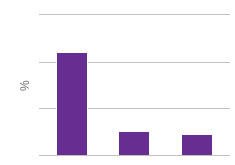
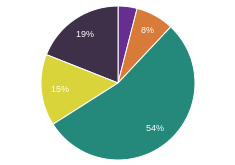
Top 3 Experiential Purchases »
These numbers represent the percent of purchases within each category for experiential purchases combining all three studies. In comparison, for…
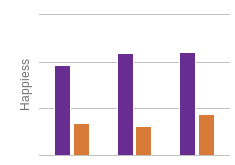
Experiential Products Make Us Happiest When Things Go Bad »
From research articles to popular blogs, everyone agrees that you should spend your money on life experiences. But this experience…
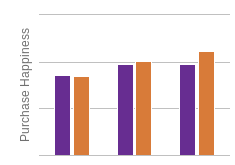
Which Purchases Make Us Happiest? »
Material items designed to create or enhance experiences, also known as "experiential products," can make shoppers just as happy as…
Material Purchase Breakdown By Purchase Type »
Spending money on experiences may lead to greater well-being than the purchase of material possessions. It is therefore conceivable that…
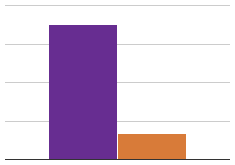
Credit Card Balance: Compulsive Versus Non-Compulsive Buyers »
In this study, compulsive buyers had higher average credit card balances per respondent when compared to other respondents. The average…
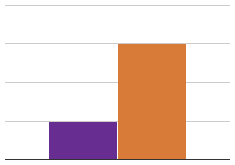
Experiential vs Material Spending Preferences »
These statistics, along with previous research, suggest that "spending money on experiences makes people happier and contributes more to overall…

