| % of Experiential Purchases That Were... | |
|---|---|
| Electronic Devices/Video Games | 55 |
| Sporting Goods | 13 |
| Clothing/Jewelry/Accessories | 11 |
%
Sources:
sciencedirect.com
Share:


| % of Experiential Purchases That Were... | |
|---|---|
| Electronic Devices/Video Games | 55 |
| Sporting Goods | 13 |
| Clothing/Jewelry/Accessories | 11 |
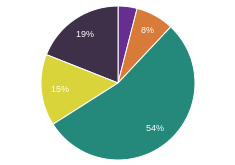
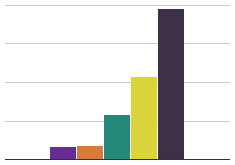
These numbers represent the percent of purchases within each category for experiential purchases combining all three studies. In comparison, for material purchases, clothing, jewelry and accessories represented 62% of purchases. Electronic devices and video games represented 24% of purchases.