“housing” Charts
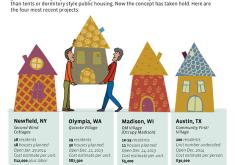
Tiny Houses for the Homeless: A Big Idea Has Arrived »
More than 3.5 million people experience homelessness in the United States each year. But a growing number of towns and…
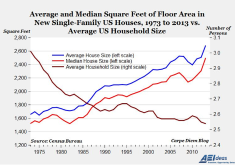
Our households are shrinking but our houses are growing »
In 2013, the average size of new houses built increased to an all-time high of 2,679 square feet. Over the…
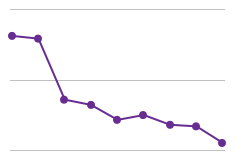
Defeating Homelessness »
From 2005 to 2013 there has been an overall decline in the number of homeless people. With around a decline…
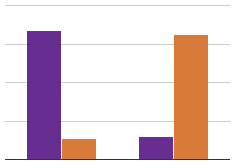
The Politics of Where and How You Live »
Liberals and conservatives disagree about more than just who to vote for. According to a Pew research study, liberals also…
CLTs: Long-term Solution to Affordable Housing »
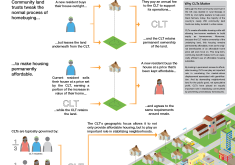
CLTs allow prospective homeowners to buy homes outright while the CLT maintains ownership of the land. This allows the homeowners…
What Happens to Real Estate When You Riot? »
Aside from St. Louis, which is in the area, all of the towns listed on the chart share a border…
The Smiths »
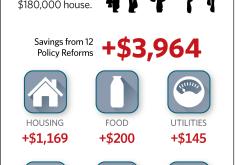
The Smiths of Westerville, Ohio are a fairly typical American family—a mother and father with three children—and they own a…
Home is for the Heart, But Where is Your Commute From? »
Americans across all income groups would prefer a longer commute as long as they were able to live in a…
Haiti Reconstruction 5 Years Later: Housing Response »
Haiti's January 12, 2010 earthquake displaced 1.5 million. Five years later, an estimated 85,432 people remain in tent camps. The…
One Reason Your Rent Is Going Up »
In short, supply and demand. More Americans are renting after so many families lost their homes in the foreclosure crisis,…
Is a new housing bubble on the horizon? »
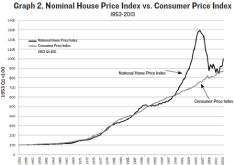
This chart compares the growth in the consumer price index to estimated national average house prices, with the egregious housing…
Improper Accounting for Fannie Mae, Freddie Mac »
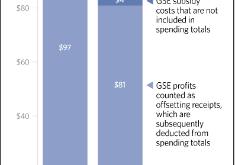
Due to improper accounting measures applied to GSEs Fannie Mae and Freddie Mac, total federal spending in FY 2013 was…
Expenditures On Housing Are Rising Modestly »
Average expenditures per consumer in 2012 increased by 3.5 percent from 2011. Most of the major components of household spending…
Spending: African Americans vs Whites »
This chart compares the share allocated to selected expenditures by ethnicity and race for 2012. Black, non-Hispanics allocated more money…
Housing Market Continues to Slow »
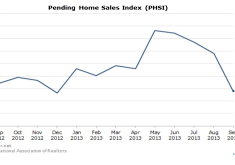
Pending Home Sales are down 8.7% from the peak in May 2013. The decline began after mortgage interest rates rose…
The House DOESN'T Always Win: Housing & The Racial Divide »
Housing, a cornerstone of the "American Dream," is the largest form of privately wealth held by families across the United…

