
| Current Dollars | Constant Dollars (Inflation Adjusted) | |
|---|---|---|
| 1995 | 29799014 | 43982680 |
| 1996 | 31713277 | 45465601 |
| 1997 | 33521207 | 46979606 |
| 1998 | 33298952 | 45952349 |
| 1999 | 33857944 | 45714118 |
| 2000 | 35018114 | 45742971 |
| 2001 | 35889344 | 45583925 |
| 2002 | 39265559 | 49095918 |
| 2003 | 41886331 | 51205812 |
| 2004 | 43316477 | 51580545 |
| 2005 | 45930433 | 52900899 |
| 2006 | 49939113 | 55720507 |
| 2007 | 51480401 | 55849514 |
| 2008 | 52786114 | 55148585 |
| 2009 | 52327630 | 54864777 |
| 2010 | 53095974 | 54771964 |
| 2011 | 54734431 | 54734431 |
Income ($ticket sales excluding commissions)
Sources:
census.gov, bls.gov
Share:

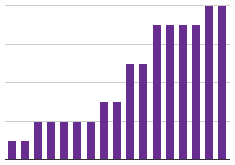
The combined total income earned by states from their lottery programs has shown a steady increase in current dollars but has been decreasing in constant dollars since 2008.