
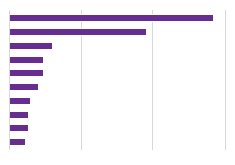
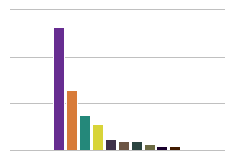
| Resident average expenditure in dollars per year on lotto | |
|---|---|
| Massachussets | 671 |
| Rhode Island | 514 |
| Delaware | 453 |
| West Virginia | 422 |
| Oklahoma | 56 |
| New Mexico | 55 |
| Montana | 49 |
| North Dakota | 36 |
Highest and Lowest Spending States
Sources:
fivethirtyeight.com
Share:

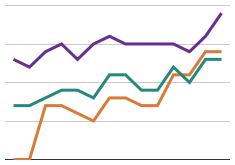
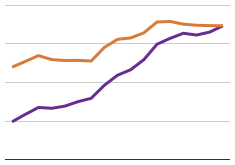
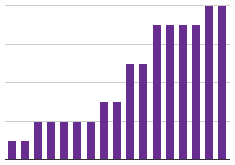
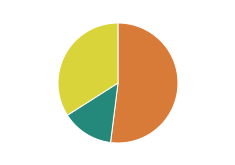
In 2012, $59.5 billion was collected from state lottery tickets. The distribution varies from state to state.