
| TV Rating | |
|---|---|
| 1970 | 28.5 |
| 1971 | 27 |
| 1972 | 22.9 |
| 1973 | 23.8 |
| 1974 | 23.4 |
| 1975 | 21.5 |
| 1976 | 27.1 |
| 1977 | 24.5 |
| 1978 | 26.1 |
| 1979 | 24.4 |
| 1980 | 26.8 |
| 1981 | 20.1 |
| 1982 | 25 |
| 1983 | 21.5 |
| 1984 | 20.1 |
| 1985 | 20.5 |
| 1986 | 20.3 |
| 1987 | 18.2 |
| 1988 | 20.4 |
| 1989 | 18.2 |
| 1990 | 16.2 |
| 1991 | 17.4 |
| 1992 | 14.9 |
| 1993 | 15.6 |
| 1994 | 15.7 |
| 1995 | 13.9 |
| 1996 | 13.2 |
| 1997 | 11.8 |
| 1998 | 13.3 |
| 1999 | 12 |
| 2000 | 10.1 |
| 2001 | 11 |
| 2002 | 9.5 |
| 2003 | 9.5 |
| 2004 | 8.8 |
| 2005 | 8.1 |
| 2006 | 9.3 |
| 2007 | 8.4 |
| 2008 | 9.3 |
| 2009 | 8.9 |
| 2010 | 7.5 |
| 2011 | 6.9 |
| 2012 | 6.8 |
% of American TV Households Watching the Broadcast
Sources:
baseball-almanac.com
Share:

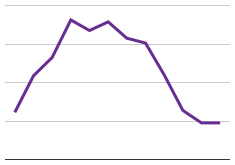
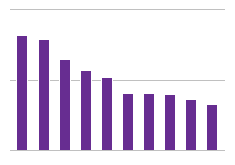
The MLB All-Star Game seems to have lost its appeal. The TV ratings since the 1970s have been steadily declining, reaching an all-time low in 2012 with a rating of 6.8, meaning that only 6.8% of American households with televisions were tuned in.