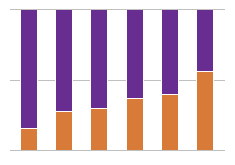
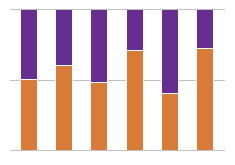
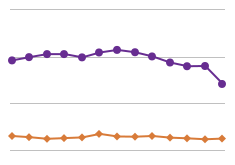
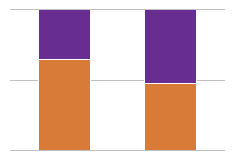
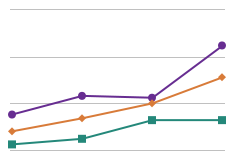
Since 1999, the primary reasons gun owners in America posses weapons has changed dramatically. Those saying their weapons are primarily for protection has leaped 22 percentage points, to 48% in 2013. The previous most popular reason, hunting, has dropped 17 percentage points to 32%.
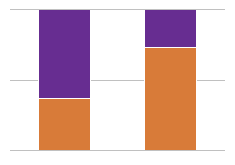
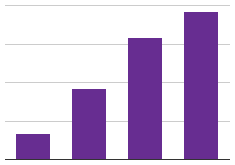
Peter -- I think this chart is misleading; the data is (presumably) correct, but the truncated vertical scale exaggerates the degree of impact, and needlessly. If this is a site about getting at the truth, it seems to me there's a higher standard. I would bet that a stacked bar chart that adds up to 100%, with one bar for the two year samples would let you call out this shift just as clearly (if not more).
Glad you took a look at my chart. We at SavvyRoo are still working on incorporating a wider array of graph models and functionality into our chart builder; until then, we nevertheless hope our users remain mindful of axis values. I hope you'll stay around to see new features rolling out soon - users that are quicker to pose a rebuttal than hit 'Like' are infinitely more valuable to everyone involved.
So, it looks like the chart builder automatically truncates the vertical axis, and there is no way to change it. This is a HUGE design flaw that can negatively impact the credibility of the data presented. I like what SavvyRoo is trying to accomplish, but any beginning statistics class will tell you to be wary of truncated axes as they can, as Tom points out, exaggerate the degree of impact of the data presented.
Aaron Ennis I noticed that after I wrote my comment. Totally agree. Excel and Google Apps have alternate chart tools that are probably better alternatives until this kind of thing gets fixed.
But I know Stephen Ostermiller is up late at nights getting all of this stuff tweaked up.


 of
of

")
Since 1999, the primary reasons gun owners in America posses weapons has changed dramatically. Those saying their weapons are primarily for protection has leaped 22 percentage points, to 48% in 2013. The previous most popular reason, hunting, has dropped 17 percentage points to 32%.
Peter -- I think this chart is misleading; the data is (presumably) correct, but the truncated vertical scale exaggerates the degree of impact, and needlessly. If this is a site about getting at the truth, it seems to me there's a higher standard. I would bet that a stacked bar chart that adds up to 100%, with one bar for the two year samples would let you call out this shift just as clearly (if not more).
Hi Tom,
Glad you took a look at my chart. We at SavvyRoo are still working on incorporating a wider array of graph models and functionality into our chart builder; until then, we nevertheless hope our users remain mindful of axis values. I hope you'll stay around to see new features rolling out soon - users that are quicker to pose a rebuttal than hit 'Like' are infinitely more valuable to everyone involved.
Stay Savvy!
So, it looks like the chart builder automatically truncates the vertical axis, and there is no way to change it. This is a HUGE design flaw that can negatively impact the credibility of the data presented. I like what SavvyRoo is trying to accomplish, but any beginning statistics class will tell you to be wary of truncated axes as they can, as Tom points out, exaggerate the degree of impact of the data presented.
Aaron Ennis I noticed that after I wrote my comment. Totally agree. Excel and Google Apps have alternate chart tools that are probably better alternatives until this kind of thing gets fixed.
But I know Stephen Ostermiller is up late at nights getting all of this stuff tweaked up.