| Obese | Normal Weight | Underweight | |
|---|---|---|---|
| January | 27.3 | 35.3 | 1.8 |
| February | 28.2 | 35.1 | 1.7 |
| March | 28.4 | 34.8 | 1.8 |
| April | 28.8 | 34.4 | 1.7 |
BMI Classifaction
Months (2015)
% of BMI Scores
Sources:
gallup.com
Share:


| Obese | Normal Weight | Underweight | |
|---|---|---|---|
| January | 27.3 | 35.3 | 1.8 |
| February | 28.2 | 35.1 | 1.7 |
| March | 28.4 | 34.8 | 1.8 |
| April | 28.8 | 34.4 | 1.7 |
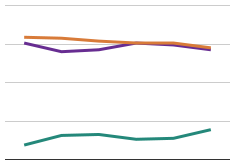
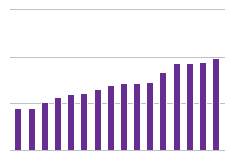
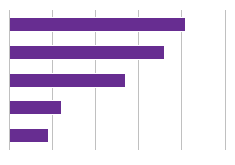
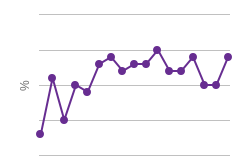
This chart shows how the percentage of Americans BMI scores have been since the start of 2015.