
Decreasing Reliance on Public School Transportation
by Steven Davies on Jul 29, 2013 | Views: 299 | Score: 0
| 1 | |
|---|---|
| 1929-30 | 8.9 |
| 1931-32 | 10.9 |
| 1933-34 | 12.4 |
| 1935-36 | 14.6 |
| 1937-38 | 16.9 |
| 1939-40 | 18.8 |
| 1941-42 | 21.4 |
| 1943-44 | 23 |
| 1945-46 | 25.5 |
| 1947-48 | 28 |
| 1949-50 | 31.2 |
| 1951-52 | 33.1 |
| 1953-54 | 32.8 |
| 1955-56 | 35 |
| 1957-58 | 36.5 |
| 1959-60 | 37.6 |
| 1961-62 | 38.1 |
| 1963-64 | 38.7 |
| 1965-66 | 39.7 |
| 1967-68 | 42 |
| 1969-70 | 43.4 |
| 1971-72 | 46.1 |
| 1973-74 | 51.5 |
| 1975-76 | 52.8 |
| 1977-78 | 54.4 |
| 1979-80 | 56.7 |
| 1980-81 | 59.1 |
| 1981-82 | 60 |
| 1982-83 | 60.6 |
| 1983-84 | 60.6 |
| 1984-85 | 61.3 |
| 1985-86 | 60.3 |
| 1986-87 | 60.8 |
| 1987-88 | 59.8 |
| 1988-89 | 60.7 |
| 1989-90 | 59.4 |
| 1990-91 | 57.3 |
| 1991-92 | 59.5 |
| 1992-93 | 59.2 |
| 1993-94 | 59.4 |
| 1994-95 | 58.2 |
| 1995-96 | 58.2 |
| 1996-97 | 57 |
| 1997-98 | 56.9 |
| 1998-99 | 57.7 |
| 1999-2000 | 57 |
| 2000-01 | 55.5 |
| 2001-02 | 55 |
| 2002-03 | 54.7 |
| 2003-04 | 55.5 |
| 2004-05 | 55.5 |
| 2005-06 | 55 |
| 2006-07 | 54.8 |
| 2007-08 | 54.6 |
% of students transported at public expense
Sources:
nces.ed.gov
Share:

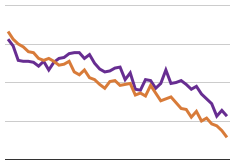
The percentage of students transported at public expense has been slowly decreasing since peaking at 61.3% in 1984-85. In 2007-08, only 54.6% of students cost the public money.