High School Dropout Rate: Males vs. Females
by Steven Davies on Jul 29, 2013 | Views: 456 | Score: 2
| Males | Females | |
|---|---|---|
| 1967 | 16.5 | 17.3 |
| 1968 | 15.8 | 16.5 |
| 1969 | 14.3 | 16 |
| 1970 | 14.2 | 15.7 |
| 1971 | 14.2 | 15.2 |
| 1972 | 14.1 | 15.1 |
| 1973 | 13.7 | 14.5 |
| 1974 | 14.2 | 14.3 |
| 1975 | 13.3 | 14.5 |
| 1976 | 14.1 | 14.2 |
| 1977 | 14.5 | 13.8 |
| 1978 | 14.6 | 13.9 |
| 1979 | 15 | 14.2 |
| 1980 | 15.1 | 13.1 |
| 1981 | 15.1 | 12.8 |
| 1982 | 14.5 | 13.3 |
| 1983 | 14.9 | 12.5 |
| 1984 | 14 | 12.3 |
| 1985 | 13.4 | 11.8 |
| 1986 | 13.1 | 11.4 |
| 1987 | 13.2 | 12.1 |
| 1988 | 13.5 | 12.2 |
| 1989 | 13.6 | 11.7 |
| 1990 | 12.3 | 11.8 |
| 1991 | 13 | 11.9 |
| 1992 | 11.3 | 10.7 |
| 1993 | 11.2 | 10.9 |
| 1994 | 12.3 | 10.6 |
| 1995 | 12.2 | 11.7 |
| 1996 | 11.4 | 10.9 |
| 1997 | 11.9 | 10.1 |
| 1998 | 13.3 | 10.3 |
| 1999 | 11.9 | 10.5 |
| 2000 | 12 | 9.9 |
| 2001 | 12.2 | 9.3 |
| 2002 | 11.8 | 9.2 |
| 2003 | 11.3 | 8.4 |
| 2004 | 11.6 | 9 |
| 2005 | 10.8 | 8 |
| 2006 | 10.3 | 8.3 |
| 2007 | 9.8 | 7.7 |
| 2008 | 8.5 | 7.5 |
| 2009 | 9.1 | 7 |
| 2010 | 8.5 | 6.3 |
High school dropout rate (%)
Sources:
nces.ed.gov

 of
of

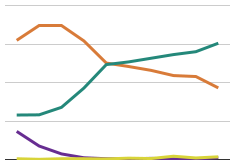
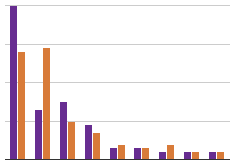
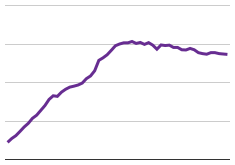
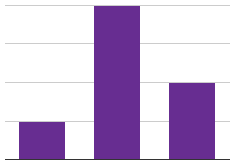
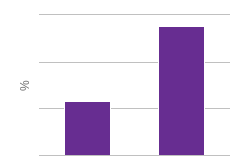
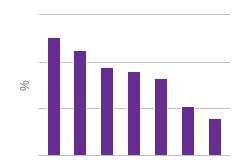
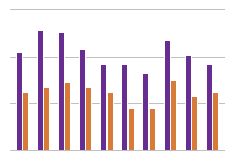
The high school dropout rate among Americans ages 16 to 24 has been decreasing since 1967. However, the sex with the greater dropout rate has reversed. Ever since 1977, females have had the lower dropout rate. In 2010, 6.3% of females were high school dropouts, compared to 8.5% of males.