| Percent of income spent on ... Education | Clothes and shoes | Food at restaurants, etc. | Entertainment | Health care and health insurance | Savings for retirement | Food at home | Utilities | Transportation and Gasoline | Housing | |
|---|---|---|---|---|---|---|---|---|---|---|
| $15,000 - $19,999 | 1.5 | 3.6 | 4.7 | 4.8 | 8.2 | 2.6 | 10.2 | 11.1 | 20.4 | 29.2 |
| $50,000 - $69,999 | 1.3 | 3.2 | 5.4 | 5.1 | 7.1 | 9.6 | 7.7 | 8.2 | 21.3 | 26.7 |
| Above $150,000 | 4.4 | 3.7 | 5.4 | 5.7 | 4.5 | 15.9 | 5.4 | 4.8 | 15.5 | 27.5 |
Household Income Level
%
Sources:
npr.org

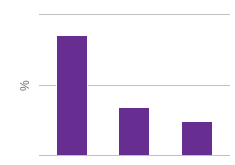
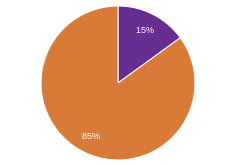
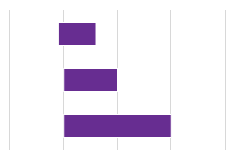
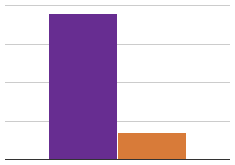
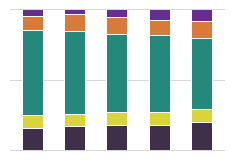
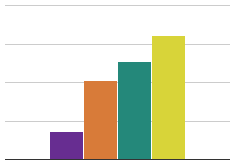
Income plays a vital role in how different Americans are able to spend their money. Through an examination of different income strata - one below the poverty line, one in the middle of the income distribution, and one on top - we are able to identify the different spending behaviors of the groups. Perhaps the most notable difference between the three groups is the amount each group saves for retirement. While the group under the poverty line invests a paltry 2.6 percent in retirement, the upper income level invests an impressive 15.9 percent.