“2009-stimulus” Charts
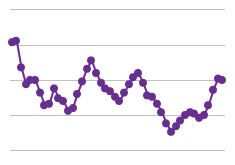
The Fluctuation of the U.S. Poverty Rate »
This chart shows the poverty rate based on CPI research series using current methods, meaning that money income is adjusted.…
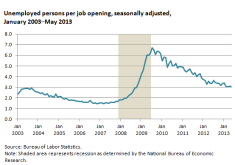
Unemployed Persons per Job Opening »
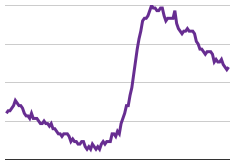
After peaking at 6.7 in July 2009, the number of unemployed Americans per job opening has decreased to 3.07 in…
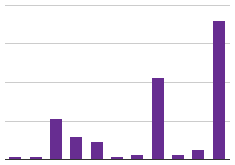
U.S. Still Suffering From High Unemployment »
Since 1949, the U.S. unemployment rate has risen to 7.5% or above 11 different times. Currently, the unemployment rate has…
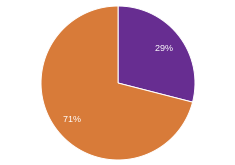
Did Obama's 2009 Stimulus Work? »
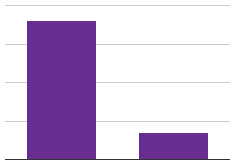
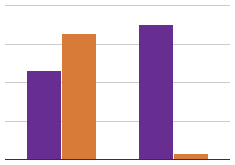
In a survey conducted by debate.org, most Americans said they do not believe that Obama's 2009 stimulus worked.
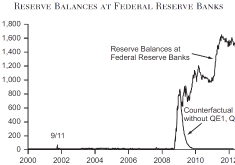
The Fed's Recent Unconventional Actions »
During the financial panics in 2001 and 2008, the Fed increased the supply of reserve balances, thereby supplying liquidity to…
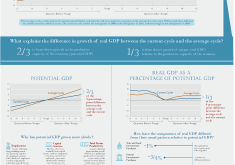
Why is the economy growing so slowly? »
The U.S. economy has grown slowly since the recession in 2008 and 2009. In the three years following the recession,…
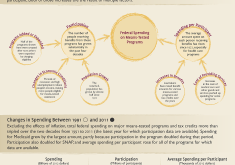
The Government Lends a Helping Hand »
Federal means-tested programs and tax credits provide cash payments or assistance with health care, nutrition, education, housing, or other needs…
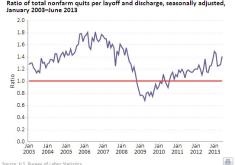
When Quitting is a Good Thing »
The ratio of quits per layoffs and discharges increased to 1.41 in June 2013, up from the lowest ratio of…
Perceived Severity of Economic Issues Down Significantly »
The 2009 stimulus was a historic piece of legislation that seems to have bettered the economic conditions of many Americans.…
Obama's Stimulus Salvation: State of Economy, With/Without »
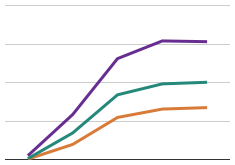
Economic projections, including those from Moody's Analytics, US Bureau of Economic Analysis, and Bureau of Labor Statistics, have shown the…
Obama's Stimulus Salvation: Effect on the Economy »
In March 2009, before it was launched, Q1 GDP was -6.4%, by the end of 2009 it was 5%. The…
Unemployment Rate Still Not Near Previous Levels »
Though the U.S. unemployment rate has been declining, it is still much higher than it was before the crash. The…

