
U.S. Still Suffering From High Unemployment
by Steven Davies on Jul 29, 2013 | Views: 533 | Score: 2
| 1 | |
|---|---|
| 1949 | 1 |
| 1958 | 1 |
| 1975-76 | 16 |
| 1976-77 | 9 |
| 1980 | 7 |
| 1981(Jan) | 1 |
| 1981(May-June) | 2 |
| 1981-84 | 32 |
| 1984(July-Aug) | 2 |
| 1992 | 4 |
| 2009-2013(Present) | 54 |
Consecutive weeks of unemployment rate >= 7.5
Sources:
data.bls.gov
Share:

 of
of

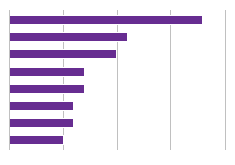
Since 1949, the U.S. unemployment rate has risen to 7.5% or above 11 different times. Currently, the unemployment rate has been at or above 7.5% for 54 consecutive months, the most consecutive months of high unemployment in over 60 years. The next closest streak was from 1981-84, with 32 consecutive months high unemployment (>=7.5).
hmmm a binary chart like this seems like it might skew perception. I'd like to see this next to a chart of average employment percentages to see if it matches up.
Also, the time scale on the bottom is a little ridiculous. It really makes it hard to understand what the data is saying.