| Sales (Actual) | Sales (Adjusted for inflation) | |
|---|---|---|
| 2001 | 28.5 | 36.95 |
| 2002 | 29.5 | 37.65 |
| 2003 | 32.4 | 40.43 |
| 2004 | 34.4 | 41.81 |
| 2005 | 36.3 | 42.67 |
| 2006 | 38.5 | 43.85 |
| 2007 | 41.2 | 45.62 |
| 2008 | 43.2 | 46.07 |
| 2009 | 45.5 | 48.69 |
| 2010 | 48.35 | 50.91 |
| 2011 | 50.96 | 52.01 |
| 2012 | 53.33 | 53.33 |
U.S. Pet Industry Expenditures per Year ($billions)
Sources:
americanpetproducts.org, bls.gov

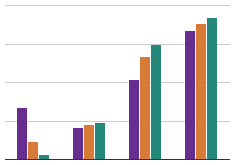
The U.S. pet industry is booming! Not only have sales steadily increased from 2001 to 2012, but sales adjusted for inflation have increased by about 44%. Even the lackluster economy of recent years has not stopped us from loving our furry (or scaly) friends.