| Food Expenditure | |
|---|---|
| 1981 | 291.3 |
| 1982 | 305.5 |
| 1983 | 325.1 |
| 1984 | 345.8 |
| 1985 | 362.6 |
| 1986 | 380.6 |
| 1987 | 397.1 |
| 1988 | 427.2 |
| 1989 | 453.4 |
| 1990 | 489.6 |
| 1991 | 512.6 |
| 1992 | 522.9 |
| 1993 | 544.8 |
| 1994 | 568.2 |
| 1995 | 588.6 |
| 1996 | 606.3 |
| 1997 | 635.6 |
| 1998 | 657 |
| 1999 | 686.8 |
| 2000 | 724.5 |
| 2001 | 755.6 |
| 2002 | 782.4 |
| 2003 | 825.2 |
| 2004 | 859.4 |
| 2005 | 916.7 |
| 2006 | 962.9 |
| 2007 | 1011.1 |
| 2008 | 1051.4 |
| 2009 | 1047.7 |
| 2010 | 1080.2 |
| 2011 | 1139.3 |
Food Expenditure in Billions
Sources:
ers.usda.gov

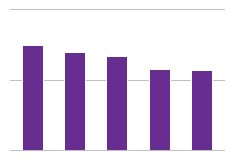
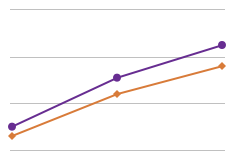
US Food expenditure has been on a steady rise over the last twenty years. Food expenditure first topped the trillion dollar mark in 2007.The expected growth in expenditure has resumed after the plateau induced by the 2008 financial crisis. US citizens are beginning to purchase more expensive foodstuffs and eat out more often again.