Property and Casualty Breakdown from 2005 to 2013
by Esther Rochon on Sep 4, 2015 | Views: 327 | Score: 1
| P&C Premiums (Total) | Auto Insurance Premiums | Homeowners Insurance Premiums | |
|---|---|---|---|
| 2005 | 234.3 | 192.2 | 57.8 |
| 2006 | 242.5 | 193 | 60.8 |
| 2007 | 246 | 191.6 | 64.7 |
| 2008 | 236.7 | 188.9 | 65 |
| 2009 | 221.5 | 186.3 | 67.6 |
| 2010 | 216.3 | 187.8 | 71 |
| 2011 | 228.2 | 190.5 | 73.7 |
| 2012 | 239.8 | 197.4 | 77.9 |
| 2013 | 252.9 | 207.3 | 82.7 |
$ Billions
Sources:
naic.org, mintel.com

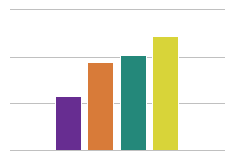
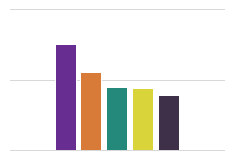
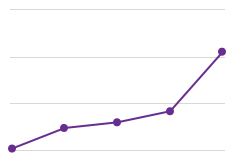
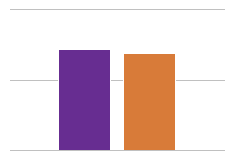
The 2008-2009 crisis affected the property and casualty industry, but it had a steady increase since 2010. The homeowners insurance premiums have grown constantly since 2005 while the auto insurance premiums have been affected by the crisis. This shows that P&C actuarial job forecast is great because the industry is growing.
Nice point, Esther.
Kent