| Clothing | 69 |
|---|---|
| Digital Content | 59 |
| Accessories | 54 |
| Personal Electronics | 49 |
| Household Electronics | 43 |
| Cosmetics & Personal Grooming | 35 |
| Prescription Medications | 26 |
| Speciality Food/Beverages | 25 |
| Over the Counter Medications | 18 |
| Groceries | 15 |
What Shoppers are Buying (%)
Percent Who Have Purchased Online
Sources:
dbsquaredinc.com

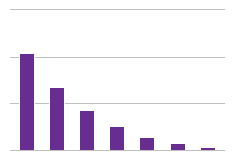
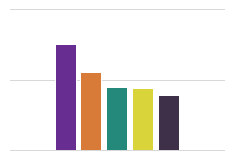
It is quite interesting to see that the preference in consumers is changing from traditionally buying in stores to now online. This bar graph depicts the percentage of what shoppers in the United States have purchased online in a given category.