
| Exports | Imports | Balance | |
|---|---|---|---|
| 2000 | 16185.2 | 100018.2 | -83833 |
| 2001 | 19182.3 | 102278.4 | -83096.1 |
| 2002 | 22127.7 | 125192.6 | -103064.9 |
| 2003 | 28367.9 | 152436.1 | -124068.2 |
| 2004 | 34427.8 | 196682 | -162254.3 |
| 2005 | 41192 | 243470.1 | -202278.1 |
| 2006 | 53673 | 287774.4 | -234101.3 |
| 2007 | 62936.9 | 321442.9 | -258506 |
| 2008 | 69732.8 | 337772.6 | -268039.8 |
| 2009 | 69496.7 | 296373.9 | -226877.2 |
| 2010 | 91911.1 | 364952.6 | -273041.6 |
| 2011 | 104121.5 | 399371.2 | -295249.7 |
| 2012 | 110515.6 | 425626.2 | -315110.6 |
| 2013 | 121736.4 | 440447.7 | -318711.3 |
| 2014 | 124024 | 466656.5 | -342632.5 |
Years
U.S. dollars (in millions)
Sources:
census.gov
Share:

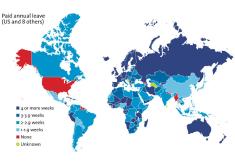
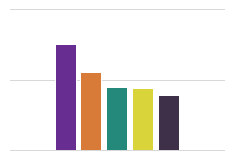
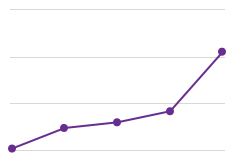
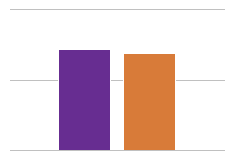
The chart shows that the U.S. trade deficit with China keeps growing because imports are rising faster than exports. Why is there a U.S. trade deficit with China? The United States imports consumer electronics, clothing and machinery from China. A lot of the imports are from U.S.-based companies that send raw materials to China for cheap assembly. When they are shipped back to the U.S., they are called imports even though they are profiting American-owned companies.