“stock-market-crash” Charts
The Fluctuation of the U.S. Poverty Rate »
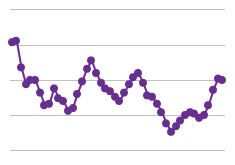
This chart shows the poverty rate based on CPI research series using current methods, meaning that money income is adjusted.…
Unemployed Persons per Job Opening »
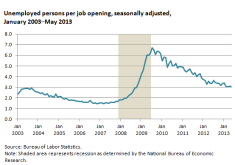
After peaking at 6.7 in July 2009, the number of unemployed Americans per job opening has decreased to 3.07 in…
U.S. Still Suffering From High Unemployment »
Since 1949, the U.S. unemployment rate has risen to 7.5% or above 11 different times. Currently, the unemployment rate has…
Mortgage Flow: Great Depression vs. Great Recession »
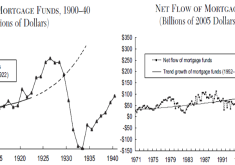
In the years preceding both the Great Depression and the Great Recession, the net flow of mortgage funds surged above…
The Fed's Recent Unconventional Actions »
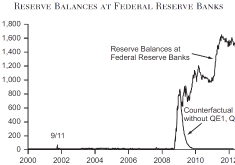
During the financial panics in 2001 and 2008, the Fed increased the supply of reserve balances, thereby supplying liquidity to…
Why is the economy growing so slowly? »
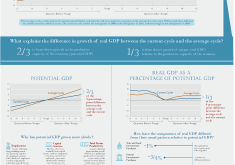
The U.S. economy has grown slowly since the recession in 2008 and 2009. In the three years following the recession,…
Tenure Gender Gap Closes »
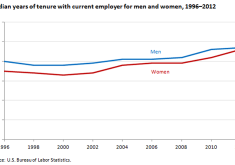
In recent years, the gap in median tenure between genders has closed. The median tenure for men in 1996 was…
Employee Tenure Has Increased »
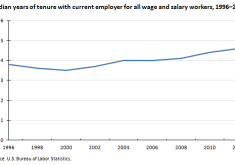
From 2000 to 2012, the median U.S. employee tenure increased from 3.5 years of tenure to 4.6 years. This rise…
When Quitting is a Good Thing »
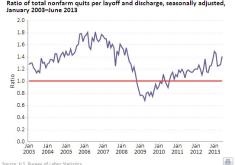
The ratio of quits per layoffs and discharges increased to 1.41 in June 2013, up from the lowest ratio of…
Americans Are Sticking With The Job Search »
Unemployed Americans are spending a longer time looking for jobs before they give up and leave the labor force. In…
Fewer Bank Failures »
After the financial crisis in 2008, banks began closing their doors as they went out of business and were acquired.…

