The Growth of Video Streaming in Sports Last Year
by Kamil Skwarek on Feb 18, 2015 | Views: 350 | Score: 0
| Time spent streaming per viewer (min) | # of streams per viewer | |
|---|---|---|
| Oct 2013 | 32.6 | 16.5 |
| Nov 2013 | 30.1 | 16.1 |
| Dec 2013 | 39.6 | 17.8 |
| Jan 2014 | 47 | 20.6 |
| Feb 2014 | 45.9 | 27.8 |
| Mar 2014 | 58.9 | 60 |
| April 2014 | 68.4 | 169.4 |
| May 2014 | 50.9 | 92.4 |
| Jun 2014 | 54.8 | 145.6 |
| Jul 2014 | 76.6 | 214.4 |
| Aug 2014 | 55.3 | 79.7 |
| Sep 2014 | 54.6 | 116.8 |
| Oct 2014 | 43.9 | 94.6 |
Sources:
nielsen.com

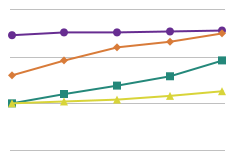
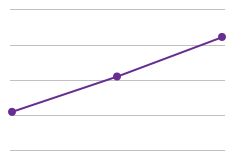
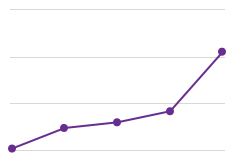
Last year the number of streams per viewer and time spent streaming sports continued to increase. The peaks in April, June, and July correspond to March Madness, the NBA Playoffs, and the World Cup.
It would be interesting to compare the time spent streaming and number of streams during April, June, and July of earlier years. Still, the overall trend in the number of streams is definitely on the rise. How will this effect sports TV networks, if it effects them at all?
Kendra, I think it will at the very least force networks to continue to diversify the ways in which they deliver content to viewers, and continue to invest in these new markets as they draw more consumers.