| Firearm applications received | Applications denied | |
|---|---|---|
| 1999 | 8621000 | 204000 |
| 2000 | 7753000 | 153000 |
| 2001 | 8068000 | 151000 |
| 2002 | 7926000 | 136000 |
| 2003 | 7883000 | 126000 |
| 2004 | 8133000 | 126000 |
| 2005 | 8324000 | 132000 |
| 2006 | 8772000 | 135000 |
| 2007 | 8836000 | 136000 |
| 2008 | 10131000 | 147000 |
| 2009 | 11071000 | 150000 |
| 2010 | 10643000 | 153000 |
| 2011 | 12135000 | 160000 |
| 2012 | 15718000 | 192000 |
Sources:
bjs.ojp.usdoj.gov

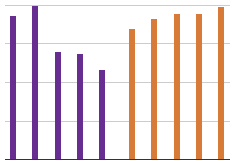
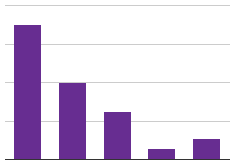
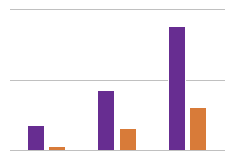
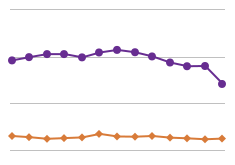
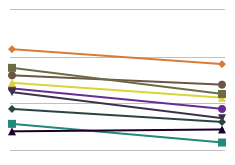
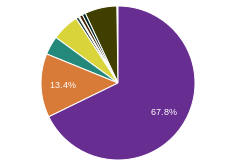
While the number of firearm applications denied in 2012 was roughly the same as in 1999, the number of total applications nearly doubled in that time. Thus, in this time frame, percentage denied went from 2.4% of applications (1999) to 1.2% of applications (2012).