The Fish Are Biting: Spike in Commercial Fisheries Landings
by Steven Davies on Jul 24, 2013 | Views: 286 | Score: 2
| 1 | |
|---|---|
| 1950 | 2258042.8 |
| 1951 | 2057920.2 |
| 1952 | 2056271.1 |
| 1953 | 2093762.8 |
| 1954 | 2205149 |
| 1955 | 2238972.9 |
| 1956 | 2445910.5 |
| 1957 | 2215752 |
| 1958 | 2215437.2 |
| 1959 | 2358941.5 |
| 1960 | 2304603.9 |
| 1961 | 2426700.5 |
| 1962 | 2487377.7 |
| 1963 | 2241111.4 |
| 1964 | 2112764.1 |
| 1965 | 2214960.3 |
| 1966 | 1998565 |
| 1967 | 1875367.3 |
| 1968 | 1984171.5 |
| 1969 | 2019191.2 |
| 1970 | 2239812.6 |
| 1971 | 2346839.5 |
| 1972 | 2261654.3 |
| 1973 | 2267603.4 |
| 1974 | 2332203.1 |
| 1975 | 2303027.3 |
| 1976 | 2533382.3 |
| 1977 | 2436336 |
| 1978 | 2793253.7 |
| 1979 | 2933981.2 |
| 1980 | 2974843 |
| 1981 | 2731286.4 |
| 1982 | 2920341 |
| 1983 | 2900463.1 |
| 1984 | 2903067.9 |
| 1985 | 2894262.3 |
| 1986 | 2783567.1 |
| 1987 | 3183651.3 |
| 1988 | 3352566.5 |
| 1989 | 3969033.2 |
| 1990 | 4457084.1 |
| 1991 | 4558772.4 |
| 1992 | 4656812.7 |
| 1993 | 4618540.5 |
| 1994 | 4751765.1 |
| 1995 | 4487444.2 |
| 1996 | 4361123.7 |
| 1997 | 4504491.4 |
| 1998 | 4222472 |
| 1999 | 4263389.5 |
| 2000 | 4147172.4 |
| 2001 | 4314450 |
| 2002 | 4280288.2 |
| 2003 | 4311551.7 |
| 2004 | 4394764 |
| 2005 | 4405514.1 |
| 2006 | 4301894.2 |
| 2007 | 4222562.2 |
| 2008 | 3791013.6 |
| 2009 | 3656367 |
| 2010 | 4864866.8 |
| 2011 | 5864763.6 |
Commercial fisheries landings (metric tons)
Sources:
st.nmfs.noaa.gov, st.nmfs.noaa.gov

 of
of

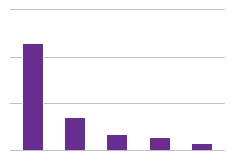
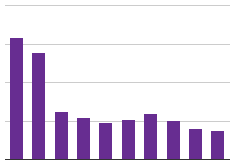

In just a few years, commercial fisheries have increased their catches by over 2.2 million metric tons, from 3.6 million metric tons in 2009 to 5.8 million metric tons in 2011. This spike comes after a decrease of over 1 million metric tons of landings from 1994 to 2009.