| % among nonvoters | % among voters | |
|---|---|---|
| Family Income Under 30 Thousand | 46 | 19 |
| Nonwhite | 43 | 23 |
| Under Age 30 | 34 | 10 |
Demographic
Sources:
people-press.org
Share:


| % among nonvoters | % among voters | |
|---|---|---|
| Family Income Under 30 Thousand | 46 | 19 |
| Nonwhite | 43 | 23 |
| Under Age 30 | 34 | 10 |
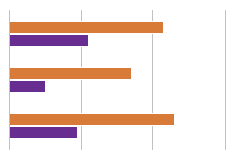
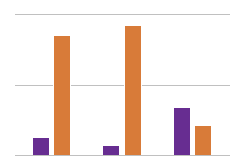
According to a recent Pew poll, individuals that do not vote in elections tend to belong to certain demographics. Generally, those people that are not likely to show up on election day tend to be financially strained, racially diverse and young.
You can give a lot of credit for this to the Republicans for pushing voter ID laws and reducing early voting. Two of the most despicable political acts in recent times.