| % likely voters | % among nonvoters | |
|---|---|---|
| Non-White | 22 | 43 |
| Under age 30 | 10 | 34 |
| Family income under $30k | 19 | 46 |
Sources:
people-press.org
Share:


| % likely voters | % among nonvoters | |
|---|---|---|
| Non-White | 22 | 43 |
| Under age 30 | 10 | 34 |
| Family income under $30k | 19 | 46 |
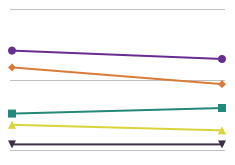
The demographics of non-voters are very different than voters. Those who likely will not show up to the polls tend to be more racially diverse, younger, and less affluent.