This Chart Helps Explain Why Children Flee Across the Border
by SavvyRoo on Aug 4, 2014 | Views: 186 | Score: 0
| Honduras | El Salvador | Guatemala | Mexico | United States | |
|---|---|---|---|---|---|
| 2000 | 50.9 | 39.3 | 25.9 | 10.3 | 5.5 |
| 2001 | 54.8 | 36.9 | 28.1 | 9.8 | 6.6 |
| 2002 | 55.8 | 37 | 30.9 | 9.5 | 5.6 |
| 2003 | 61.4 | 36.4 | 35.1 | 9.3 | 5.6 |
| 2004 | 53.8 | 45.8 | 36.4 | 8.5 | 5.5 |
| 2005 | 46.6 | 62.2 | 42.1 | 9 | 5.6 |
| 2006 | 44.3 | 64.4 | 45.3 | 9.3 | 5.8 |
| 2007 | 50 | 57.1 | 43.4 | 7.8 | 5.6 |
| 2008 | 60.8 | 51.7 | 46.1 | 12.2 | 5.4 |
| 2009 | 70.7 | 70.9 | 46.5 | 17 | 5 |
| 2010 | 81.8 | 64.1 | 41.6 | 21.8 | 4.7 |
| 2011 | 91.4 | 69.9 | 38.6 | 22.8 | 4.7 |
| 2012 | 90.4 | 41.2 | 39.9 | 21.5 | 4.7 |
Homicide rate (per 100,000)

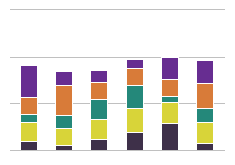
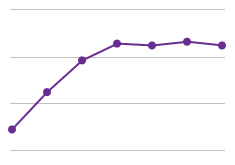
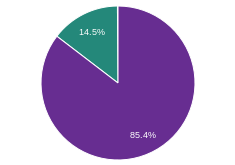
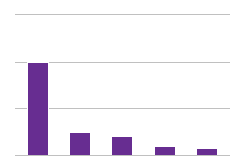
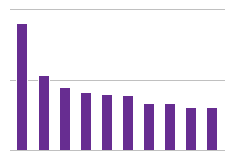
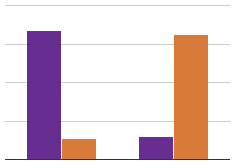
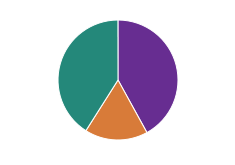
Tens of thousands of children have been detained at the U.S.-Mexico border this year, most of them from Central America. One reason why is the epidemic of violence in Honduras, El Salvador, and Guatemala, with gang-related murder—particularly of young people—an increasingly common occurrence. In El Salvador, for example, 38% of those murdered are between the ages of 15 and 24.