U.S. Trade Deficit Gap With China Is Growing
by Steven Davies on Jun 5, 2013 | Views: 134 | Score: 2
| Imports | Exports | |
|---|---|---|
| 1985 | 3861.7 | 3855.7 |
| 1986 | 4771 | 3106.3 |
| 1987 | 6293.6 | 3497.3 |
| 1988 | 8510.9 | 5021.6 |
| 1989 | 11989.7 | 5755.4 |
| 1990 | 15237.4 | 4806.4 |
| 1991 | 18969.2 | 6278.2 |
| 1992 | 25727.5 | 7418.5 |
| 1993 | 31539.9 | 8762.9 |
| 1994 | 38786.8 | 9281.7 |
| 1995 | 45543.2 | 11753.7 |
| 1996 | 51512.8 | 11992.6 |
| 1997 | 62557.7 | 12862.2 |
| 1998 | 71168.6 | 14241.2 |
| 1999 | 81788.2 | 13111.1 |
| 2000 | 100018.2 | 16185.2 |
| 2001 | 102278.4 | 19182.3 |
| 2002 | 125192.6 | 22127.7 |
| 2003 | 152436.0969 | 28367.94286 |
| 2004 | 196682.0339 | 34427.77246 |
| 2005 | 243470.1048 | 41192.01012 |
| 2006 | 287774.3526 | 53673.00834 |
| 2007 | 321442.8669 | 62936.89158 |
| 2008 | 337772.6278 | 69732.83754 |
| 2009 | 296373.8835 | 69496.67861 |
| 2010 | 364952.6336 | 91911.08094 |
| 2011 | 399378.942 | 103986.4958 |
| 2012 | 425578.9205 | 110483.5868 |
U.S. trade in goods with China ($ millions)
Sources:
census.gov

 of
of

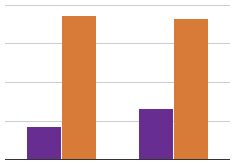
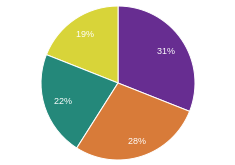
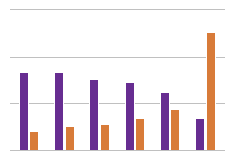
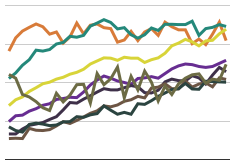
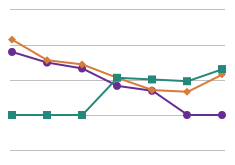
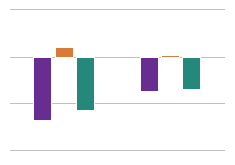

In 2012, the U.S. both imported more from China and exported more to China than ever before. However, the rate at which imports are increasing is much faster than the rate that exports are increasing, causing a growing trade deficit gap. The trade deficit in 2012 was 315 billion dollars.