| Total, 16 years and older | 16-19 years | 20-24 years | 25-34 years | 35-44 years | 45-54 years | 55-64 years | 65 years and older | |
|---|---|---|---|---|---|---|---|---|
| 1979 | 62.3 | 85.2 | 76.3 | 67.5 | 58.3 | 56.8 | 60.6 | 77.6 |
| 1980 | 64.2 | 89.5 | 78.1 | 69.4 | 58.3 | 56.9 | 59.4 | 76.4 |
| 1981 | 64.4 | 91.7 | 80.6 | 70.3 | 59.9 | 56.8 | 58.9 | 71.1 |
| 1982 | 65.7 | 92.9 | 82.4 | 72.1 | 61.1 | 60.1 | 61.4 | 70.3 |
| 1983 | 66.5 | 94 | 85.5 | 73.3 | 61.5 | 59.5 | 61.8 | 68.8 |
| 1984 | 67.6 | 93.1 | 85.2 | 74.6 | 62 | 59.4 | 61.5 | 66.8 |
| 1985 | 68.1 | 90.7 | 85.7 | 75.1 | 63 | 59.7 | 61 | 65.9 |
| 1986 | 69.5 | 91.4 | 87.5 | 76.1 | 63.9 | 60.9 | 61.2 | 71.5 |
| 1987 | 69.8 | 87.8 | 88 | 76.7 | 66.1 | 62.3 | 62.2 | 68.7 |
| 1988 | 70.2 | 89.8 | 90 | 77.7 | 68.5 | 61.7 | 62.3 | 70.9 |
| 1989 | 70.1 | 94.3 | 89.7 | 78.3 | 68.3 | 62.7 | 63.9 | 74.3 |
| 1990 | 71.9 | 90.8 | 90.3 | 79.3 | 69.6 | 63.8 | 63.7 | 74.4 |
| 1991 | 74.2 | 93.6 | 93.3 | 81 | 70.7 | 65 | 64.5 | 68.3 |
| 1992 | 75.8 | 94 | 94.3 | 82 | 71.9 | 65.8 | 64.9 | 77.9 |
| 1993 | 77.1 | 92.8 | 95.4 | 83 | 73 | 67.4 | 67.4 | 74.3 |
| 1994 | 76.4 | 92.5 | 94.5 | 82.9 | 72.6 | 67.1 | 66 | 76.2 |
| 1995 | 75.5 | 88.1 | 92.4 | 82.2 | 72.6 | 67.7 | 64.7 | 80 |
| 1996 | 75 | 88.8 | 92.8 | 83.2 | 73.3 | 68.9 | 65.3 | 70 |
| 1997 | 74.4 | 91.6 | 90.5 | 82.9 | 74 | 69.4 | 64.7 | 77 |
| 1998 | 76.3 | 88.6 | 89.4 | 82.9 | 73.6 | 70.5 | 68.1 | 72.6 |
| 1999 | 76.5 | 91.4 | 90.5 | 81.5 | 71.7 | 70 | 67.9 | 78.7 |
| 2000 | 76.9 | 92.5 | 92.7 | 82.4 | 71.6 | 73.2 | 69.1 | 75.1 |
| 2001 | 76.4 | 90.3 | 91.9 | 83 | 72.5 | 73.5 | 70.5 | 69 |
| 2002 | 77.9 | 94.6 | 93.9 | 84.5 | 75.2 | 74.6 | 71.6 | 73.8 |
| 2003 | 79.4 | 93.1 | 93.9 | 86.9 | 76.1 | 73 | 72.7 | 71.1 |
| 2004 | 80.4 | 92.1 | 93.8 | 87.8 | 75.6 | 72.9 | 73 | 74.6 |
| 2005 | 81 | 92.1 | 93.8 | 89 | 75.5 | 75.5 | 74.7 | 76.4 |
| 2006 | 80.8 | 87.6 | 94.9 | 88.2 | 77.2 | 73.5 | 72.9 | 77.5 |
| 2007 | 80.2 | 89.1 | 90.3 | 86.9 | 76.5 | 74.5 | 72.8 | 77.8 |
| 2008 | 79.9 | 87.3 | 92.5 | 88.5 | 74.5 | 74.9 | 75.4 | 74.8 |
| 2009 | 80.2 | 90.7 | 92.9 | 88.7 | 77.4 | 73.6 | 75.3 | 76.1 |
| 2010 | 81.2 | 94.6 | 93.8 | 90.8 | 79.9 | 76.5 | 75.2 | 75.7 |
| 2011 | 82.2 | 88.6 | 93.2 | 92.3 | 78.5 | 76 | 75.1 | 80.9 |
Women's earnings as a % of men's
Sources:
bls.gov

 of
of


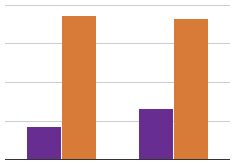
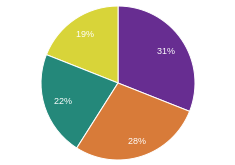
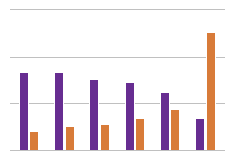
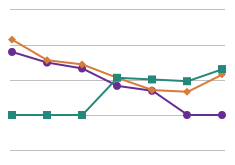
Women are still earning less than men, but the earnings gap is closing. In 1979, women on average only earned 62.3% of what men earned. By 2011, women earned 82.2% of what men earned.
This is certainly true, but there are also underlying issues contributing to the income gap that are not addressed simply in measuring "income". Closing the gap between male and female participation in leadership and executive roles is critical to ensuring more fair decision-making, and perpetuation of greater gender equality in lower level jobs as well. While closing the income gap is an important step toward equality, it requires more equal representation of women in all tiers of the workforce.
That's really interesting, though I guess it shouldn't be surprising. As the article says male doctors used to marry female nurses just because there were so few female doctors. As fewer and fewer women are underemployed, it makes sense that household income inequality would grow. However people definitely do not usually make the connection between increasing gender equality and increasing income inequality. It's rare that people consider different types of "equality" as adversarial concepts.