
| Productivity | Real Hourly Compensation | |
|---|---|---|
| 1970 | 100 | 100 |
| 1971 | 106.5 | 101.4 |
| 1972 | 111 | 103.3 |
| 1973 | 116.6 | 104.7 |
| 1974 | 113.8 | 104.7 |
| 1975 | 117.7 | 107.7 |
| 1976 | 124.1 | 110.2 |
| 1977 | 128.8 | 112.7 |
| 1978 | 129.9 | 113.2 |
| 1979 | 131.7 | 113.2 |
| 1980 | 130.7 | 114 |
| 1981 | 137.8 | 114.5 |
| 1982 | 139 | 117.9 |
| 1983 | 148.8 | 116.5 |
| 1984 | 153 | 115.8 |
| 1985 | 158.5 | 117.6 |
| 1986 | 161 | 120.9 |
| 1987 | 172.2 | 120.7 |
| 1988 | 178.8 | 120.6 |
| 1989 | 179.8 | 119.1 |
| 1990 | 181.9 | 118.9 |
| 1991 | 187 | 121.6 |
| 1992 | 194.2 | 124.2 |
| 1993 | 199.3 | 124 |
| 1994 | 207.6 | 124.4 |
| 1995 | 214.7 | 123.4 |
| 1996 | 222.1 | 122.2 |
| 1997 | 231.2 | 122.6 |
| 1998 | 243.4 | 128.4 |
| 1999 | 258.2 | 131.3 |
| 2000 | 278.3 | 136.8 |
| 2001 | 284 | 138.2 |
| 2002 | 313.3 | 143.4 |
| 2003 | 339.9 | 151.5 |
| 2004 | 369.6 | 148.7 |
| 2005 | 386.7 | 148.7 |
| 2006 | 399.9 | 146.9 |
| 2007 | 421 | 147.4 |
| 2008 | 412.9 | 148 |
| 2009 | 430 | 154.7 |
| 2010 | 478.3 | 153.9 |
| 2011 | 487.9 | 153.1 |
Productivity and compensation indexes (manufacturing)
Sources:
bls.gov
Share:


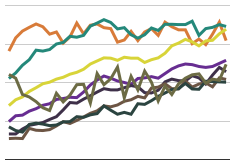
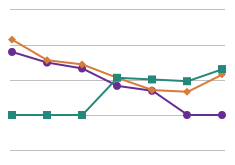
This chart measures the gap between productivity and real hourly compensation in manufacturing in the U.S. from 1970 to 2011. The indexes are based on output per hour and the corresponding compensation provided. The gap is widening, indicating that there was opportunity lost for increases in income for employees.