| Married Mother | Single Mother | Total | |
|---|---|---|---|
| 1960 | 4 | 7 | 11 |
| 1980 | 7 | 16 | 23 |
| 2000 | 13 | 21 | 33 |
| 2011 | 15 | 25 | 40 |
Percent of US Households with Mother as Sole or Primary Provider
Sources:
pewsocialtrends.org
Share:


| Married Mother | Single Mother | Total | |
|---|---|---|---|
| 1960 | 4 | 7 | 11 |
| 1980 | 7 | 16 | 23 |
| 2000 | 13 | 21 | 33 |
| 2011 | 15 | 25 | 40 |


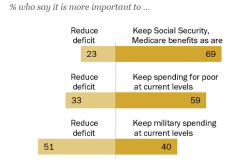
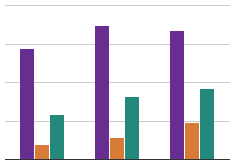
40% of households with children see the mother as sole or primary provider for the family. Many are concerned that more working moms may have negative impacts on children and families that outweigh the economic gains.