| 1 | |
|---|---|
| < $20,000 | 10 |
| $20,000 – $29,999 | 10 |
| $30,000 – $39,999 | 10 |
| $40,000 – $49,999 | 11 |
| $50,000 – $69,999 | 19 |
| $70,000 – $99,999 | 19 |
| $100,000 + | 22 |
Income of User
Percent of Coupon Enthusiasts
Sources:
statisticbrain.com
Share:


| 1 | |
|---|---|
| < $20,000 | 10 |
| $20,000 – $29,999 | 10 |
| $30,000 – $39,999 | 10 |
| $40,000 – $49,999 | 11 |
| $50,000 – $69,999 | 19 |
| $70,000 – $99,999 | 19 |
| $100,000 + | 22 |
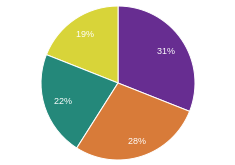
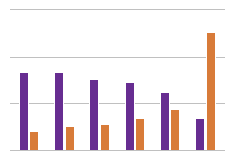
This chart shows a positive correlation between people who use coupons that make more than $50,000 a year and their income while there is virtually no correlation between coupons and income if they make less than $50,000.