Percentage of Richmond, VA Residents Living in Poverty
by daniel.scaduto on Mar 24, 2015 | Views: 118 | Score: 0
| Richmond | Virginia Average | |
|---|---|---|
| Some other Race | 38.6 | 16.4 |
| Hispanic or Latino | 33.6 | 14.8 |
| Black or African American | 28.7 | 19 |
| Pacific / Hawaiian Native | 27.4 | 7.7 |
| Asian | 27.3 | 8.1 |
| Native American | 25.8 | 13.1 |
| Two or more Races | 25.6 | 12.3 |
| White | 12.7 | 7.8 |
Sources:
city-data.com

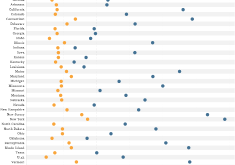
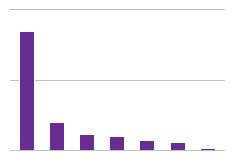
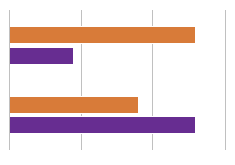
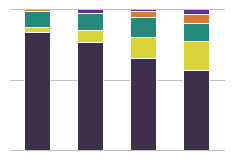
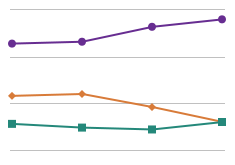
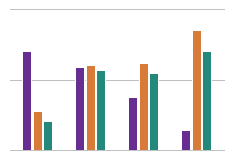
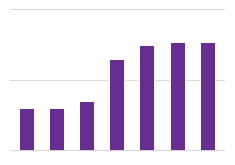
This chart pulls data from city-data.com and utilizes statical information from 2009 in order to visualize City of Richmond residents living bellow the poverty line. The statistics are separated by race and are compared to the statewide averages of Virginia