| Too busy / conflicting schedule | 17.5 |
|---|---|
| Illness or disability | 14.9 |
| Not interested | 13.4 |
| Did not like candidates or campaign issues | 12.9 |
| Out of town | 8.8 |
| Don’t know | 7 |
| Registration problems | 6 |
| Inconvienient polling place | 2.7 |
| Transportation problems | 2.6 |
| Forgot | 2.6 |
| Bad weather | 0.2 |
| Other | 11.3 |
Sources:
statisticbrain.com

 of
of

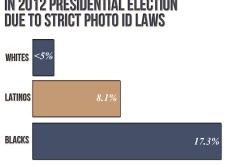
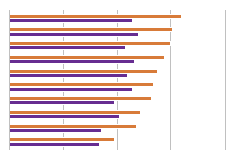
Americans have many reasons why not to vote, but it still shocks me that registration problems account for 6 percent of non-voting reasons. I think these problems, along with transportation problems and inconvenient polling locations, should be better addressed.
It surprises me that nearly 50% of those who don't vote are busy, sick, or not interested. With just a bit of planning, or research, it seems like these reasons could easily be overcome. GET OUT AND VOTE!
Many of the people I have spoken to who do not vote claim that it doesn't matter who is elected because in the end nothing changes. Maybe apathy is covered under Other.
This chart ignores the 2.5% (by 2010 figures) of Americans that are not permitted to vote through disenfranchisement. If you want people to be productive members of society they must be allowed back into it after they pay for their crimes. Being excluded from political process only feeds the feeling of separation from society in general and may even in a minute way contribute to recidivism.
I think apathy plays a large role as well. I've always wanted to see more work done on the forefront of third parties. I think we need more options than just the Democrats and Republicans. Employers placing priority on voting could also help reduce the number of voters not voting due to being too busy or not being interested.