Obama Approval Ratings: August 18-24, 2014
by Alejandro Esquino Gomez on Aug 29, 2014 | Views: 633 | Score: 2
| National Adults | Ages 18 to 29 | Ages 30 to 49 | Ages 50 to 64 | Ages 65+ | White | NonWhite | Black | Hispanic | Democrat | Independent | Republican | |
|---|---|---|---|---|---|---|---|---|---|---|---|---|
| Demographics | 43 | 49 | 44 | 39 | 38 | 33 | 65 | 80 | 55 | 76 | 38 | 10 |
Percent Approval
Sources:
gallup.com

 of
of

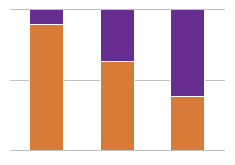
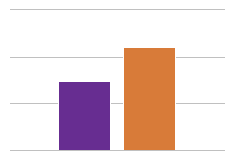
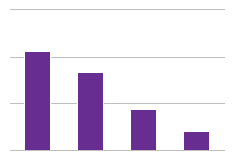
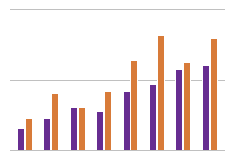
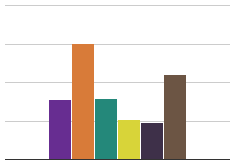
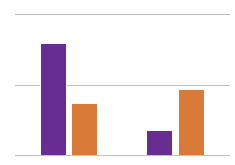
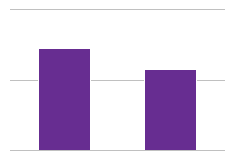
Demographic breakdown of Obama's approval ratings as of this past week. Note the polarizing effect of party politics. Republicans approve of almost three times less than the group with the second lowest approval rating, Whites. Whether it be political ideology, racism, or coincidence the disparities in the data by demographic cannot be masked.