| % Disapproval of EU leadership job performance according to Greece | Spain | Italy | |
|---|---|---|---|
| 2009 | 20 | 18 | 10 |
| 2010 | 50 | 24 | 16 |
| 2011 | 58 | 24 | 22 |
| 2012 | 66 | 39 | 32 |
| 2013 | 67 | 51 | 39 |
| 2014 | 60 | 47 | 47 |
Sources:
gallup.com
Share:


| % Disapproval of EU leadership job performance according to Greece | Spain | Italy | |
|---|---|---|---|
| 2009 | 20 | 18 | 10 |
| 2010 | 50 | 24 | 16 |
| 2011 | 58 | 24 | 22 |
| 2012 | 66 | 39 | 32 |
| 2013 | 67 | 51 | 39 |
| 2014 | 60 | 47 | 47 |

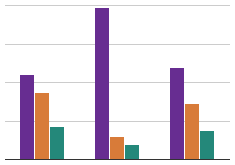


Greeks have little love for the EU. According to Gallup: "Six in 10 Greeks in 2014 disapproved of the EU's leadership, which is down from a high of 67% disapproval in 2013, but still higher than their Mediterranean neighbors in Italy and Spain, which have also had their share of major economic troubles."