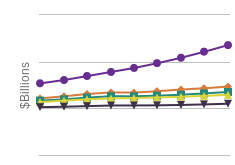
| Per capita consumption of... Flours and cereals | Red meats | Total fats | Poultry | |
|---|---|---|---|---|
| 1980 | 144.9 | 126.4 | 56.9 | 40.8 |
| 1985 | 156.7 | 124.9 | 64.1 | 45.6 |
| 1990 | 181 | 112.2 | 62.3 | 56.2 |
| 1995 | 188.7 | 113.6 | 64.2 | 62.1 |
| 2000 | 199.2 | 113.7 | 81.7 | 67.9 |
| 2005 | 191.3 | 110.2 | 85.5 | 73.7 |
| 2009 | 194.5 | 105.7 | 78.6 | 69.4 |
Pounds
Sources:
census.gov

The biggest jump in food intake per capita was in the consumption of flour and cereal products. What does this mean for our overall health?